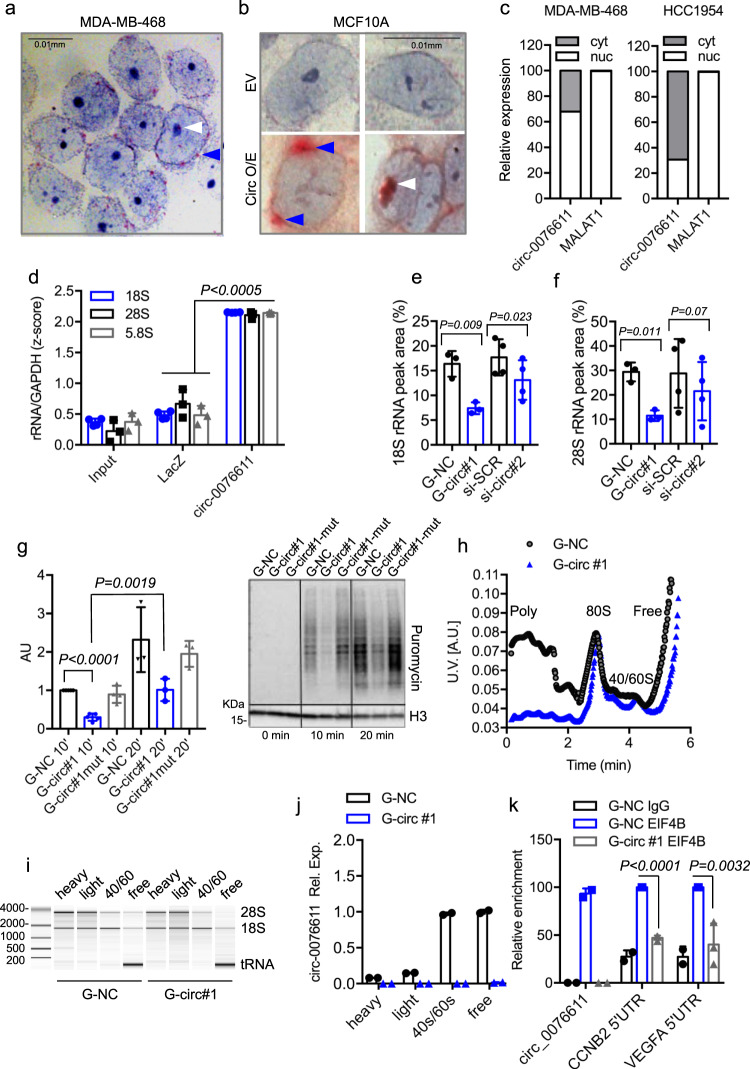
Fig. 5. Circ_0076611 impacts on the translation rate of its target mRNAs.
Analysis by in situ hybridization of circ_0076611, performed by using the BaseScope technology with a probe complementary to the circRNA back-splice junction, in MDA-MB-468 cells (a) and in MCF10A cells (b) transfected with an empty pCDNA3.1 vector (EV) or a circ_0076611 expression vector (circ O/E). Blue arrows indicate perinuclear staining while white arrows indicate nucleolar staining. Scale bar 0.01 mm. c Distribution of circ_0076611 and MALAT1 RNAs in nucleus and cytoplasm of HCC1954 and MDA-MB-468 cells. Expression has been evaluated by RT-qPCR on RNA preparations obtained by cell fractionation. d Evaluation by RT-qPCR of ribosomal RNAs 18S, 28S and 5.8S in circ_0076611-ChIRP assays. A biotinylated oligonucleotide complementary to circ_0076611 and a LacZ oligonucleotide (as negative control) were used in ChIRP assays. Results were normalized to GAPDH mRNA level and expressed as z-scores. Efficiency of circ_0076611-ChIRP is shown in Fig. 3a. p value has been calculated by paired, two-tailed Student’s t test on N = 3 independent biological replicates. e, f 18S and 28S rRNA peak areas from Bioanalyzer electropherogram analysis of total RNA (using Agilent RNA 6000 Nano Kit) from MDA-MB-468 cells transfected with GapmeRs or siRNAs to silence circ_0076611 (G-circ#1 and si-circ#2, respectively) or control oligonucleotides (G-NC, si-SCR) for 72 h. p value has been calculated by ratio paired, two-tailed Student’s t test (N ≥ 3 independent biological replicates). g Puromycin incorporation for the indicated time points, detected by western blot analysis in MDA-MB-468 cells depleted of circ_0076611 (si-circ) and in control cells (si-NC, si-circ-mut). Cells were silenced for circ_0076611 for 48 h and then challenged with 10 μg/ml of puromycin (#ant-pr-1, InvivoGen), a tyrosyl-tRNA mimic that blocks translation, for 10 or 20 min. The level of newly synthesized polypeptides was evaluated by using an anti-puromycin antibody (#MABE343, Millipore) in western blot. Quantification of puromycin signal normalized to histone H3 protein is shown in the graph while a representative western blot is shown in the right panel. p value has been calculated by paired, two-tailed Student’s t test (N ≥ 3 independent biological replicates). h, i Representative polysome profiles obtained by sucrose gradient fractionation in cytoplasmic extracts from MDA-MB-468 cells silenced for circ_0076611 expression (G-circ#1) and in control cells (G-NC) (h). A Bioanalyzer electropherogram analysis (i) has been carried out using Agilent RNA 6000 Nano Kit, loading equal amounts of RNA extracted after sucrose gradient fractionation from the indicated pools of fractions (heavy, light, 40/60S and free RNAs) to control RNA quality. j RT-qPCR analysis of circ_0076611 to evaluate its distribution in the indicated pools of fractions (heavy, light, 40S/60S and free RNAs) obtained by sucrose gradient fractionation as in h, i. k RIP assay to evaluate the enrichment of circ_0076611, CCNB2 and VEGFA mRNAs in samples immunoprecipitated with anti-EIF4B antibody or IgG in control cells (G-NC) or in circ_0076611-depleted (G-circ#1) MDA-MB-468 cells crosslinked with formaldehyde. p value has been calculated by paired, two-tailed Student’s t test (N = 3 independent biological replicates). Bars indicate standard deviation.

