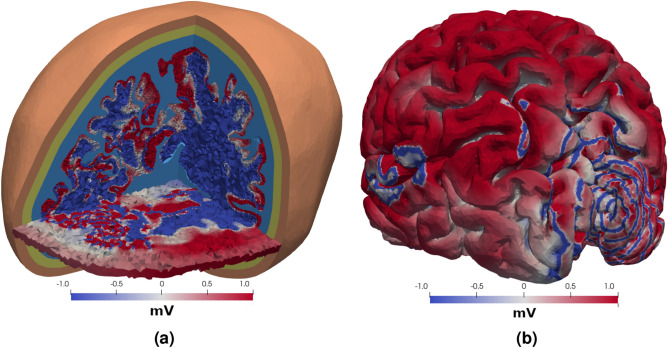
Figure 4.
Three-dimensional simulations Two visualisations of the extracellular potential in the head and on the brain surface after 100 ms. The colormap is scaled to highlight the waves, and does not cover the range of the extracellular potential. (a) The extracellular potential throughout the brain and the surrounding tissue in a corner of the head. The surrounding tissue is shown in colors similar to Fig. 1b, while the magnitude of the extracelular potential shown is shown in the grey matter and white matter. The horizontal slice also shown the magnitude of the extracelular potential in the cerebrospinal fluid, skull and scalp. (b) The extracelular potential on the surface of the brain.

