Figure 6.
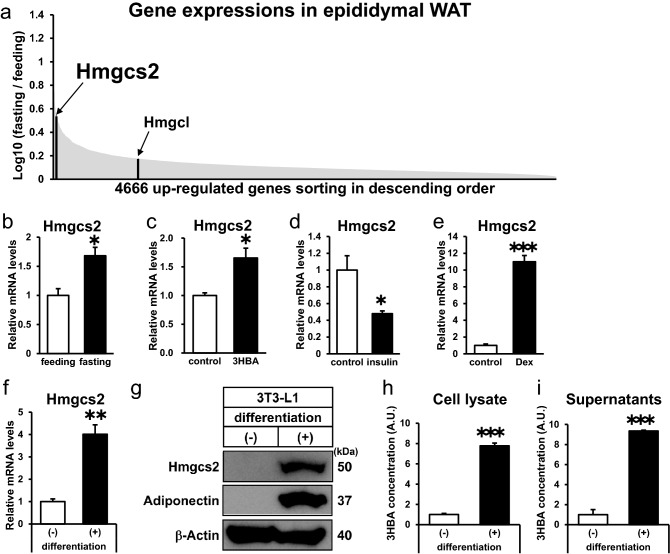
Hmgcs2 is expressed in adipose tissue in vivo and in vitro, and adipocytes produce and secrete 3HBA. (a) Schematic diagram of microarray analysis to identify fasting-inducing genes expressed in adipose tissue. The genes upregulated by fasting are sorted in descending order. The following Gene Expression Omnibus DataSet was used for the analysis: GSE46495 (fold-change > 2.0, p < 0.05; 4666 genes). (b) qRT–PCR of Hmgcs2 in epididymal adipose tissue from C57BL/6 J mice after 12 h of feeding and fasting. n = 3. (c–e) qRT–PCR of Hmgcs2 in differentiaed 3T3-L1 adipocytes after 24 h of treatment with 10 mM 3HBA (c), 1 nM insulin (d), and 1 µM dexamethasone (e). n = 3. (f) qRT–PCR of Hmgcs2. n = 3. (g) Intracellular protein of Hmgcs2. n = 1. (h and i) 3HBA concentrations in cell lysate (h) and cell culture supernatant (i) of differentiated and undifferentiated 3T3-L1 adipocytes. n = 3. For measurement of 3HBA, cell lysate was normalized per well of a 6 well plate, and culture supernatant was normalized per 2 mL media for a well of 6 well plate. Here cropped blots were displayed and all full-length blots are included in the supplemental Fig. S2. Data are mean ± SEM. *p < 0.05, **p < 0.01, ***p < 0.001. A.U., Arbitrary Unit.

