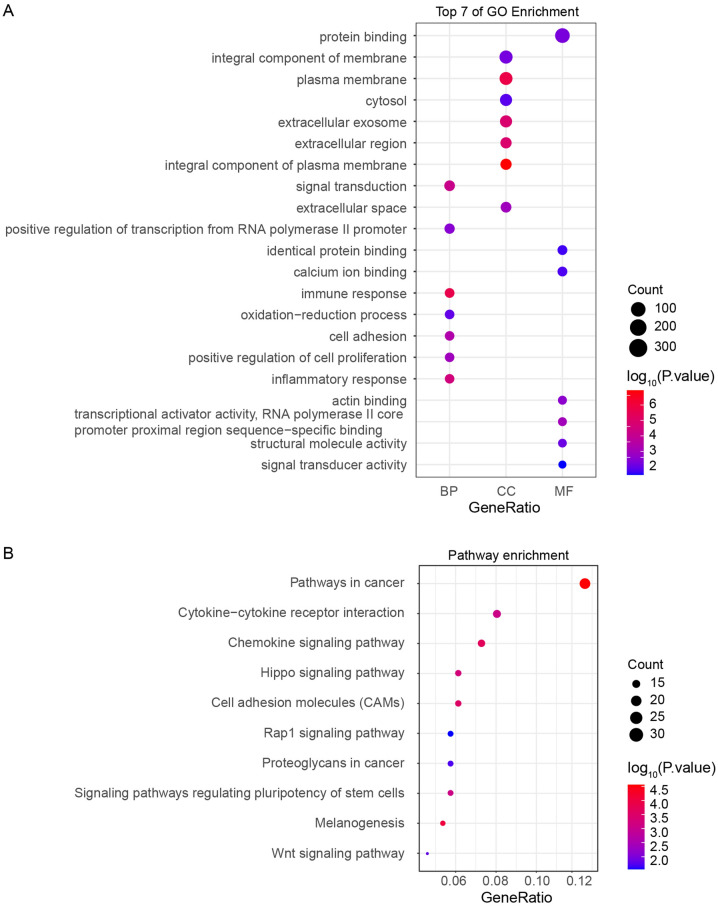
Figure 2.
GO and KEGG pathway enrichment analysis of the DEGs. (A) GO analysis of DEGs, including biological processes, cell components, and molecular functions. (B) KEGG pathway enrichment analysis of the DEGs. The GO analysis and KEGG pathway enrichment analysis of the DEGs were completed using DAVID and visualized using the ggplot2 package. GO gene ontology, KEGG Kyoto Encyclopedia of Genes and Genomes, DEG differentially expressed gene.

