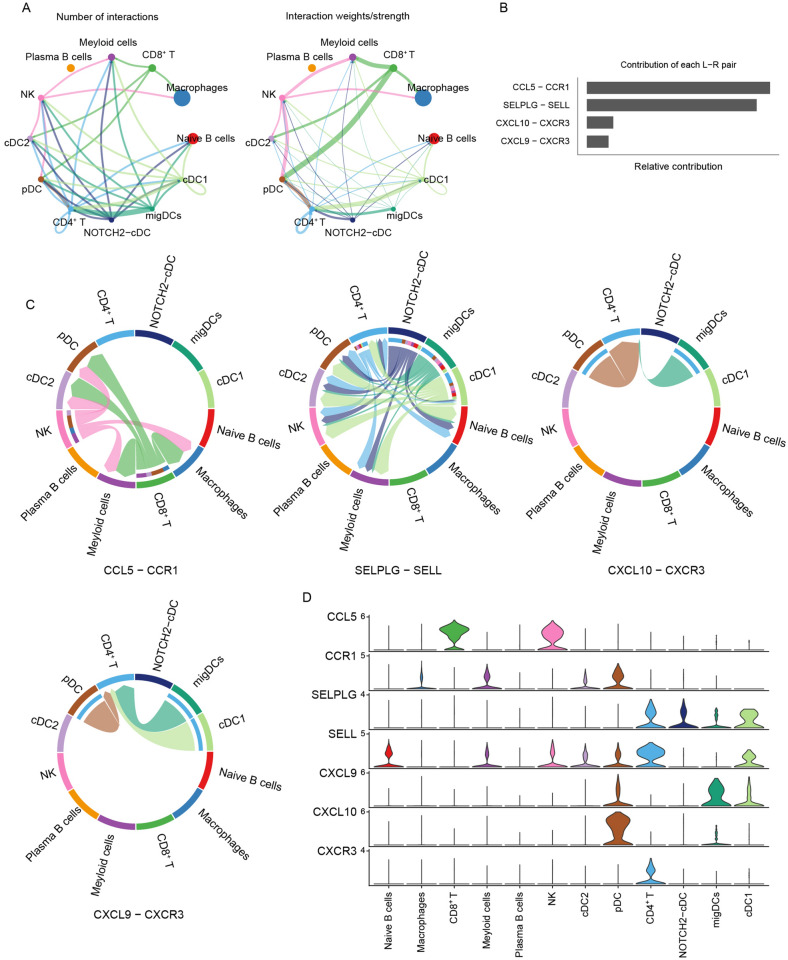
Figure 8.
Cell communication network diagram. (A) The number of ligand receptor interactions detected between different cell types. (B) Ligand receptor contribution to the overall signaling pathway. The CCL5/CCR1 ligand receptor pair contributed the most, followed by the SELPLG/SELL ligand receptor pair. (C) Receptor ligand pair interactions between immune cells. (D) The distribution and expression level of signal genes involved in the three signal pathway networks.

