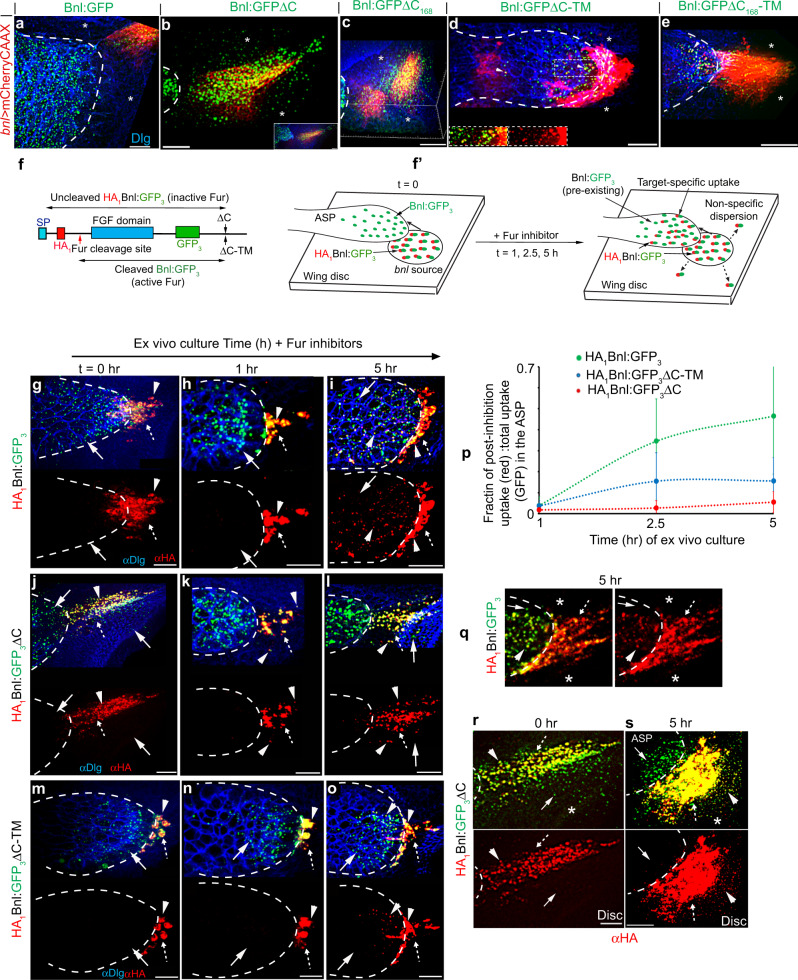
Fig. 8. GPI anchoring promotes target-specific Bnl release.
a–e Distribution patterns of Bnl:GFP variants expressed from the mCherry-marked bnl source (UAS-mCherryCAAX;bnl-Gal4 x UAS-“X”); extended Z-projections from the basal disc area and disc ASP interface shown (for 3D projections, see Supplementary Movies 12–16); b inset, extended z-stack includes ASP and disc basal area; d Inset, split-colors of ROI (box); arrowhead, source cell membrane containing Bnl:GFPΔC-TM puncta in the ASP. f Schematic map of a Furin-sensor HA1Bnl:GFP3; red arrow, Furin cleavage site; black arrow, ΔC or TM modification sites; double-sided arrows, uncleaved HA1Bnl:GFP3 and cleaved Bnl:GFP3 that were transferred to the ASP in the presence and absence of Fur inhibition, respectively. f’ Illustration depicting experimental strategy to detect ASP-specific dispersal rate of uncleaved signals in Furin-inhibited media. g–p Comparison of the ASP-specific uptake of HA1Bnl:GFP3, HA1Bnl:GFP3ΔC-TM, and HA1Bnl:GFP3ΔC (yellow puncta: red-αHA + green-GFP) from the disc source. p Graphs comparing the levels of uptake over time (see “Methods”); for each time point, values represent the mean ± SD from multiple biologically independent samples; number (n) of tissues analyzed per time point, HA1Bnl:GFP3: n = 12 (1 h), 11 (2.5 h), 10 (5 h); HA1Bnl:GFP3ΔC-TM: n = 16 (1 h), 18 (2.5 h), 15 (5 h); HA1Bnl:GFP3ΔC: n = 8 (1 h), 14 (2.5 h), 11 (5 h); p < 0.01 for HA1Bnl:GFP3 vs HA1Bnl:GFP3ΔC-TM or HA1Bnl:GFP3ΔC at 2.5 h and 5 h (one-way ANOVA followed by Tukey HSD test). q–s Comparison of HA1Bnl:GFP3 (q) and HA1Bnl:GFP3ΔC (r, s) for their ability of ASP-specific dispersion over time; all panels: dashed outline, ASP; arrow, cleaved Bnl:GFP3; arrowhead, uncleaved signal; dashed arrow, source cells; αDlg, cell outlines; asterisk, non-specific disc areas; g–s only merged and corresponding red channels were shown. Source data are provided as a Source data file. Scale bars, 20 μm.

