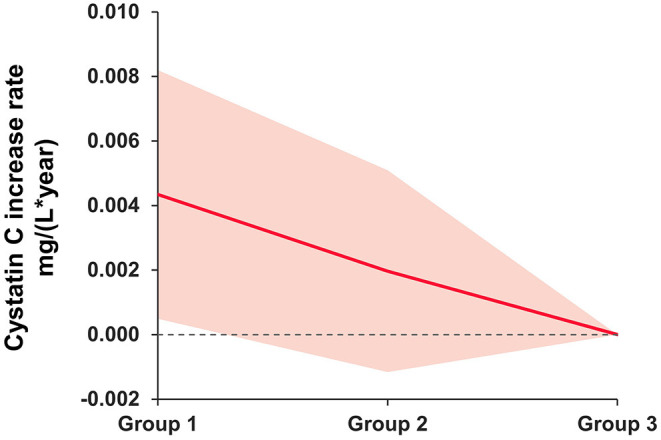
Figure 2.

Mean difference rate of change in serum cystatin C (mg/L) between baseline depressive symptom groups. Group 1 as persistent depressive symptoms. Group 2 as episodic depressive symptoms. Group 3 as no depressive symptoms. The group 3 was the reference group. Solid lines represent mean differences in serum cystatin C (mg/L) after adjusting for age, sex, race, body mass index, hypertension, and diabetes. The shadows represent the 95% CIs. The detailed results are presented in Table 3.
