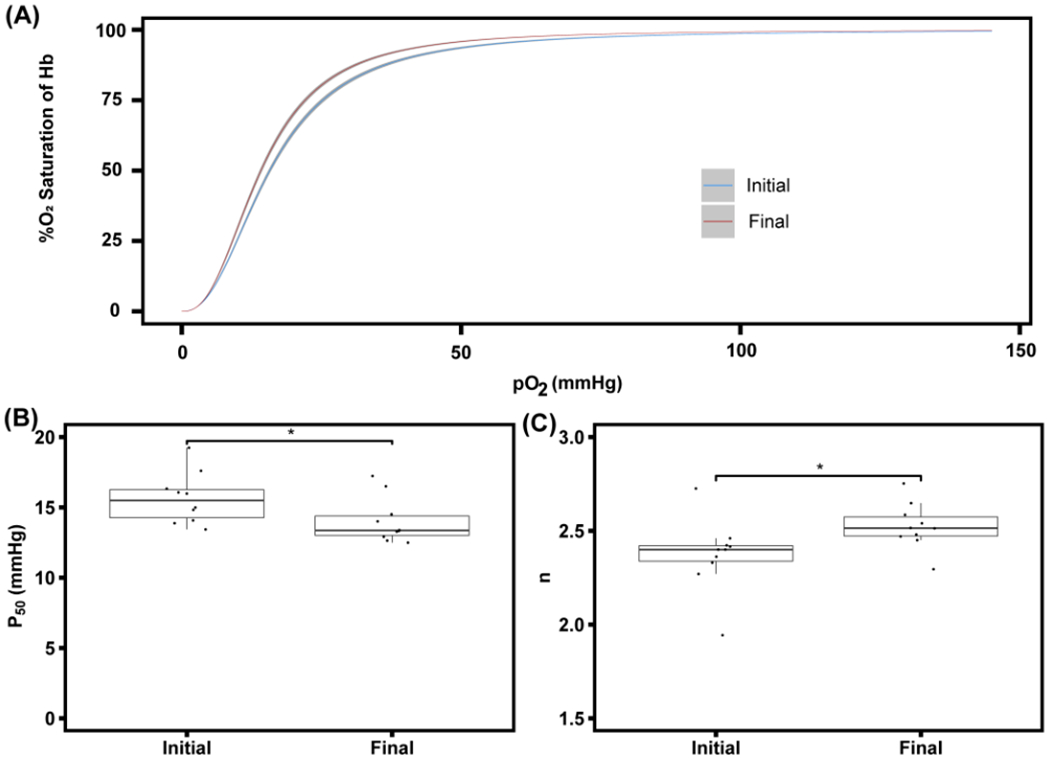
Figure 4:

Oxygen equilibrium curve (OEC) of both the initial RBC unit and 10× dicycle sample (A). 10 single RBC units were processed using the TFF RBC washing system. The OEC of the initial RBC unit is shown in blue with a dark grey 95% CI. The OEC of the final 10× sample is shown in red with a dark grey 95% CI. P50 values (B) of the initial sample from the RBC unit and the final sample (10× diacycle) post TFF wash process (p = 0.0493, *). Hill coefficient (n) (C) of the initial sample from the RBC unit and the final sample (10× diacycle) after the TFF wash process (p = 0.0493, *).
