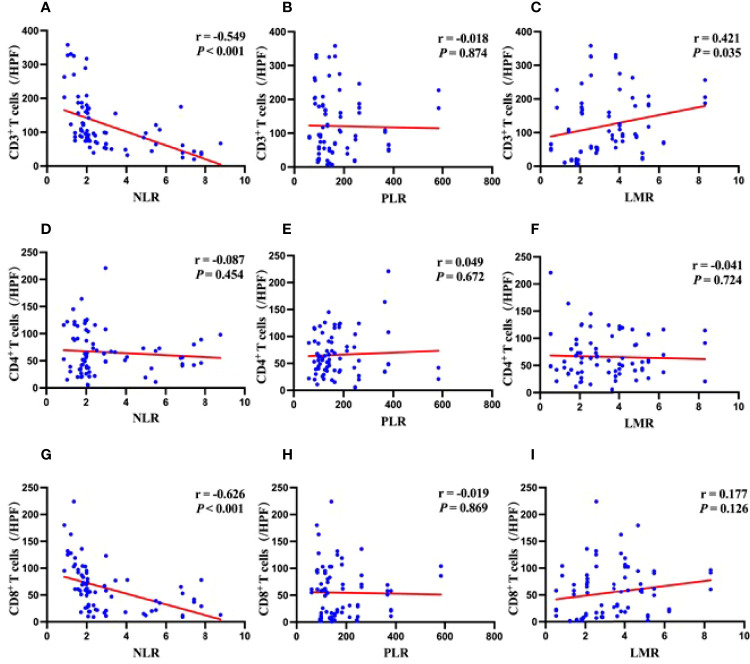
Figure 3.
Correlations between systemic inflammation markers and density of immune cells in the tumor microenvironment. (A) Correlation between NLR and levels of CD3+ T cells infiltration. (B) Correlation between PLR and levels of CD3+ T cells infiltration. (C) Correlation between LMR and levels of CD3+ T cells infiltration. (D) Correlation between NLR and levels of CD4+ T cells infiltration. (E) Correlation between PLR and levels of CD4+ T cells infiltration. (F) Correlation between LMR and levels of CD4+ T cells infiltration. (G) Correlation between NLR and levels of CD8+ T cells infiltration. (H) Correlation between PLR and levels of CD8+ T cells infiltration. (I) Correlation between LMR and levels of CD8+ T cells infiltration.

