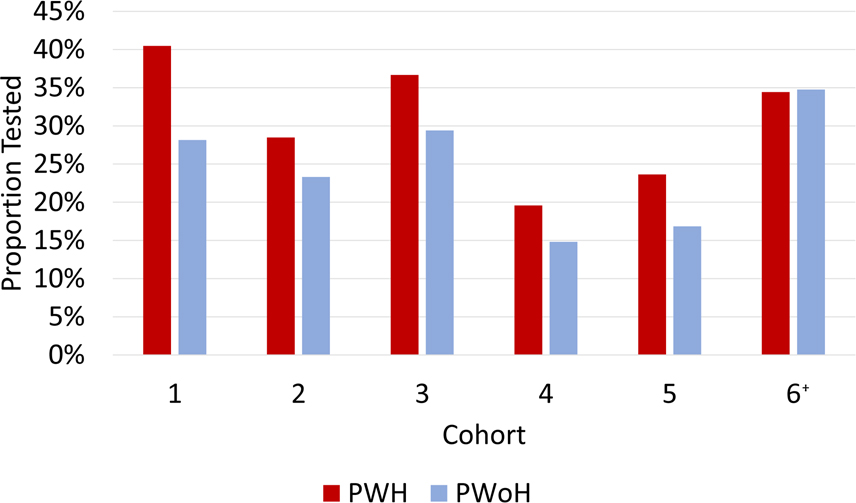
Figure 1. Proportion SARS CoV-2 RT-PCR tested at least once from March 1-December 31, 2020 by HIV status*.
Bars represent the proportion tested across the 6 cohorts by HIV status. Red bars represent persons with HIV (PWH), and blue bars represent persons without HIV (PWoH).
*χ2 p-values <0.001 for differences in proportions for cohorts 1-5, p=0.835 for cohort 6.
† Cohort 6 used a validated self-reported cohort survey to determine testing status and reported results through September 30, 2020.
Abbreviations: PWH= Persons with HIV; PWoH= Persons without HIV

