
Fig. 2.
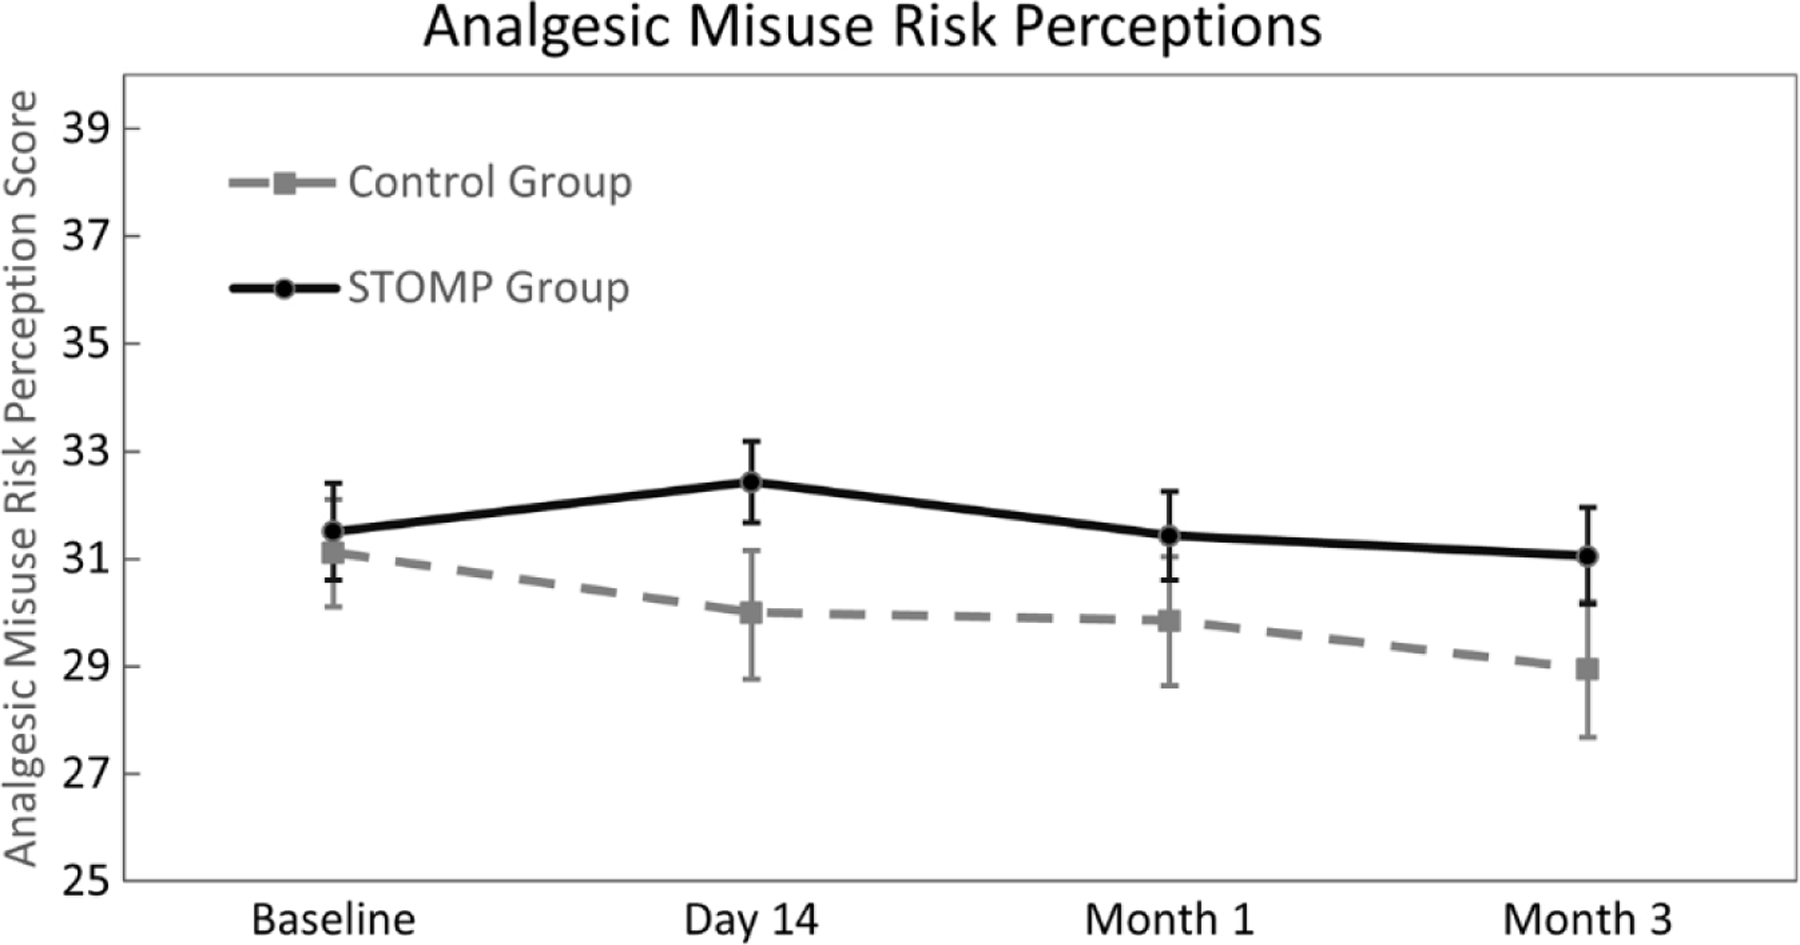
Risk perceptions between groups over time. Repeated measures analysis of variance demonstrated that perceptions decreased from baseline through Month 3 for the Control group (MD = –2.82 [95% CI –4.02, –1.64], p < .001), but remained significantly unchanged from baseline for the STOMP group (MD = 0.66 [95% CI –0.35, 1.67], p = .200).