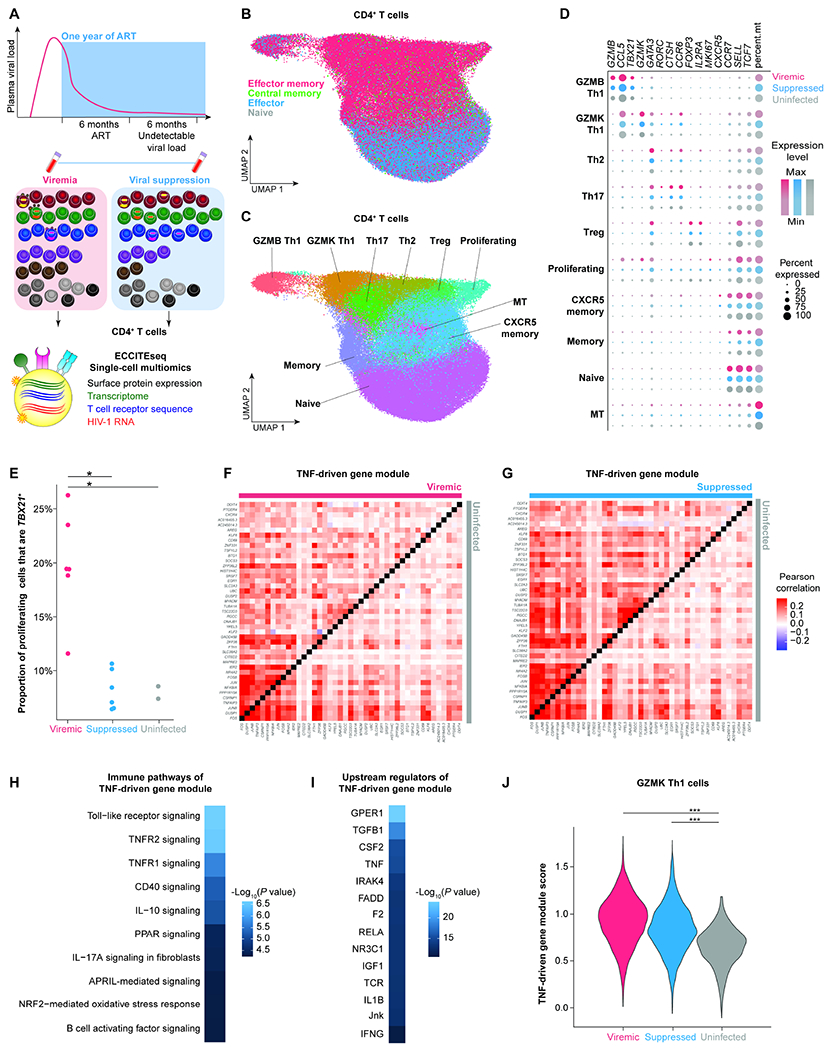
Figure 1. Paired CD4+ T cell profiling during viremia and after viral suppression by single-cell multiomic ECCITE-seq reveals persistent TNF responses despite suppressive ART.

A, Study design. Participants enrolled in the Sabes study were prospectively tested monthly for HIV-1 infection using HIV-1 antibody detection, antigen detection, and viral RNA quantification. We profiled paired CD4+ T cells during acute viremia (<60 days after estimated date of detectable infection) and after one year of suppressive ART (with documented undetectable viral load 6 months prior to the viral suppression time point) from six HIV-1-infected individuals enrolled in Sabes and subsequently followed in the Merlin study. CD4+ T cells from two sex-matched uninfected individuals were used as controls. B, UMAP plot of memory phenotypes of cells (n = 52,473, 36,806, and 33,406 cells in the viremic, virally suppressed, and uninfected conditions, respectively) defined by surface CD45RA and CCR7 expression. C, UMAP of 10 clusters of CD4+ T cells defined by transcriptome. D, Dot plot depicting key cluster marker expression in viremic, suppressed, and uninfected conditions. E, The proportion of proliferating cells expressing TBX21, the key transcription factor for Th1 polarization. P values were determined by Wilcoxon rank-sum test. F and G, Pearson’s correlation coefficient heatmaps of TNF-driven gene expression module of viremia versus uninfected conditions (F) and suppressed versus uninfected conditions (G). H and I, Ingenuity pathway analysis (IPA) heatmaps of enriched immune pathways (H) and predicted upstream regulators (I) of the TNF-driven gene expression module. P values were defined by Fisher’s exact test. J, Module score of TNF-driven gene expression module in viremia, viral suppression, and uninfected conditions in the Th1 polarized GZMK cluster. P values were determined by Wilcoxon rank-sum test comparing HIV-1-infected conditions and uninfected conditions. *, P <0.05; ***, P <0.0001. P values were corrected for multiple comparisons using the Benjamini-Hochberg procedure. See also Figure S1, Figure S2, Figure S3, Table S1, and Table S2.
