
Figure 2. T cell clone size is determined by antigen response, TNF signaling, and Th1 cytotoxic response.
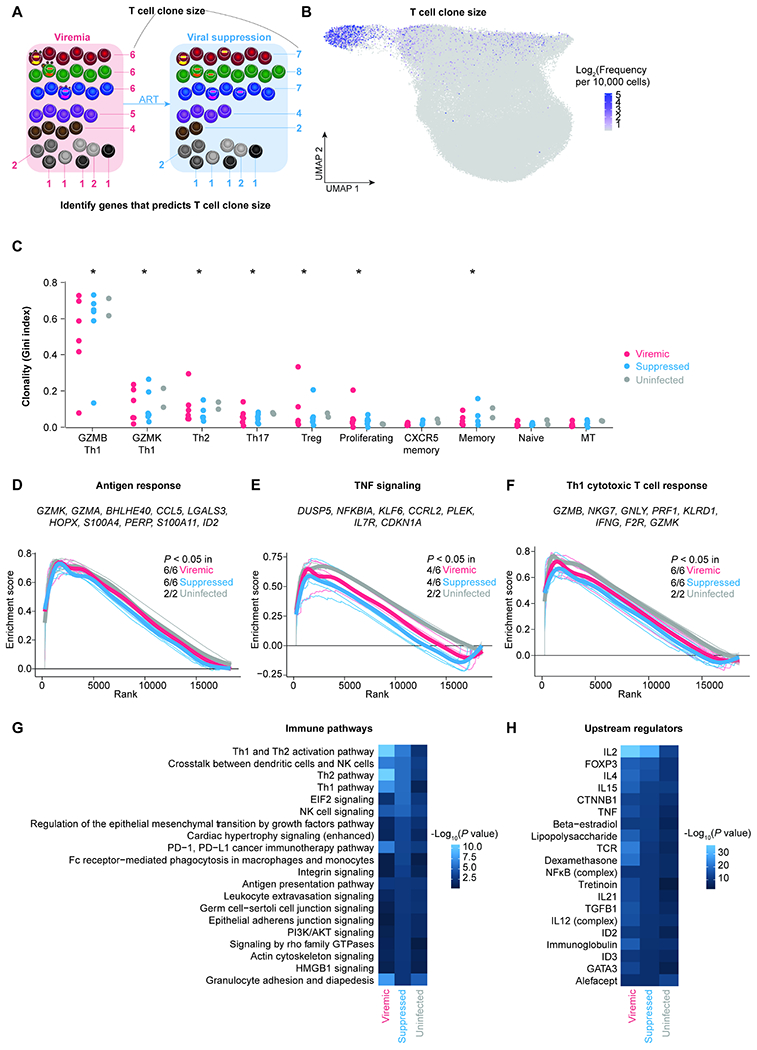
A, T cells sharing the same TCR in the same individual are identified as a T cell clone. T cell clone size is the frequency of T cells sharing the same TCR sequence out of all cells with detected TCR sequences. By calculating the correlation between T cell clone size and gene expression levels in individual cells, we can identify the determinants of T cell clone size. B, UMAP plot indicating the log2 bulk clone size of each cell based on TCRβ nucleotide CDR3 junction sequence per 10,000 CD4+ T cells. C, The level of clonality (as measured by Gini index) in each cluster in viremic, suppressed, and uninfected conditions. P values were determined by Wilcoxon rank-sum test comparing each cluster to naive cells. D–F, To identify pathways correlating with T cell clone size, we first ranked genes based on their correlation with clones size and then used Gene Set Enrichment Analysis (GSEA). We identified pathways including Goldrath antigen response (D), Hallmark TNF signaling via NFκB (E), and Bosco Th1 cytotoxic module (F). Representative leading-edge genes (the top genes enriched in each pathway) were shown in each panel. Thick lines indicate the mean enrichment score for each condition and thin lines indicate the enrichment score for each individual. G–H, Genes that were predictive of T cell clone size across cells in each condition were identified by elastic net regression. These genes were then examined by Ingenuity Pathway Analysis to determine the immune pathways (G) and upstream regulators (H). P values were defined by Fisher’s exact test. P values were corrected for multiple comparisons using the Benjamini-Hochberg procedure. *, P < 0.05. See also Figure S3 and Table S3.