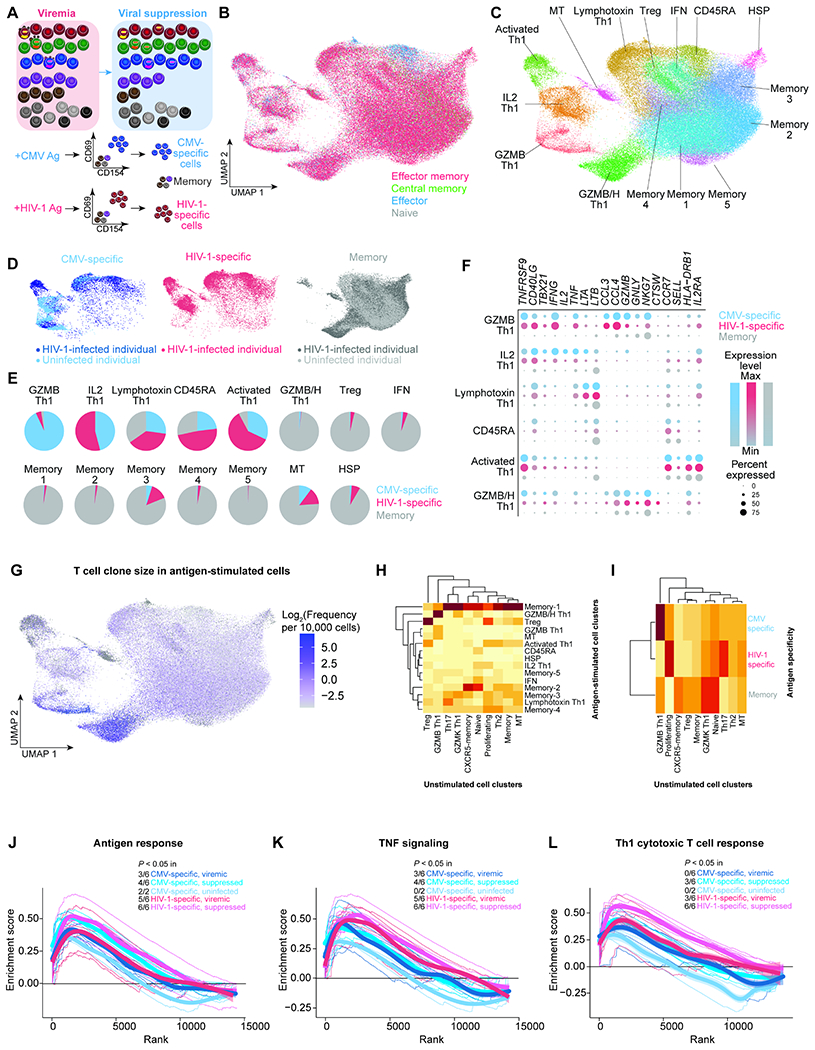
Figure 3. TCR repertoire mappings revealed the different transcriptome program of CMV-specific versus HIV-1-specific cells in unstimulated states.

A, CMV-specific and HIV-1-specific CD4+ T cells were identified as cells expressing activation inducible markers (AIM)(CD69 and CD154) after 9 hours of antigen stimulation in the presence of autologous CD8-depleted PBMC. CMV-specific cells, HIV-1-specific cells, and CD45RO+ memory cells were sorted by flow cytometry for single-cell ECCITE-seq. B, UMAP plot of memory phenotypes of cells (n =3 3,805, 44,388, and 14,580 cells in the viremic (from 6 individuals), viral suppression (from 6 individuals), and uninfected conditions (from two individuals), respectively) defined by surface CD45RA and CCR7 expression. These samples came from the same infected study participants and same timepoints as profiled in the unstimulated conditions. CD45RA and CCR7 positivity was determined by barcoded surface protein staining. C, UMAP plot of 15 transcriptionally defined clusters identified in the viremic, virally suppressed, and uninfected conditions. D, UMAP plots of cells split across CMV-specific (n = 6,091), HIV-1-specific (n = 12,183), and sorted memory cell populations (n = 59,919). E, Proportion of each cluster grouped by antigen specificity, with 5 clusters predominantly antigen responsive. F, Dot plot of key effector gene expression across antigen-specific conditions in antigen-specific clusters. G, UMAP plot indicating the T cell clone size of each cell based on TCRβ nucleotide CDR3 junction sequence per 10,000 CD4+ T cells. H, Heatmap indicating the proportion of TCR sequence overlap between unstimulated and stimulated conditions. The majority of unstimulated cells were neither CMV-specific nor HIV-1-specific cells. I, Heatmap indicating the proportion of TCR sequence overlap between unstimulated CD4+ T cells and antigen-specific CD4+ T cells. J–L, Genes ranked by correlation with T cell clone size were analyzed by Gene Set Enrichment Analysis (GSEA) to determine whether the gene expression profile is enriched in specific immune pathways, such as Goldrath antigen response (J), Hallmark TNF signaling via NFκB (K), and Bosco Th1 cytotoxic module (L). Representative leading-edge genes are shown in each panel. Thick lines indicate the mean enrichment score for each condition and think lines indicate the enrichment score for each individual. See also Figure S3, Figure S4.
