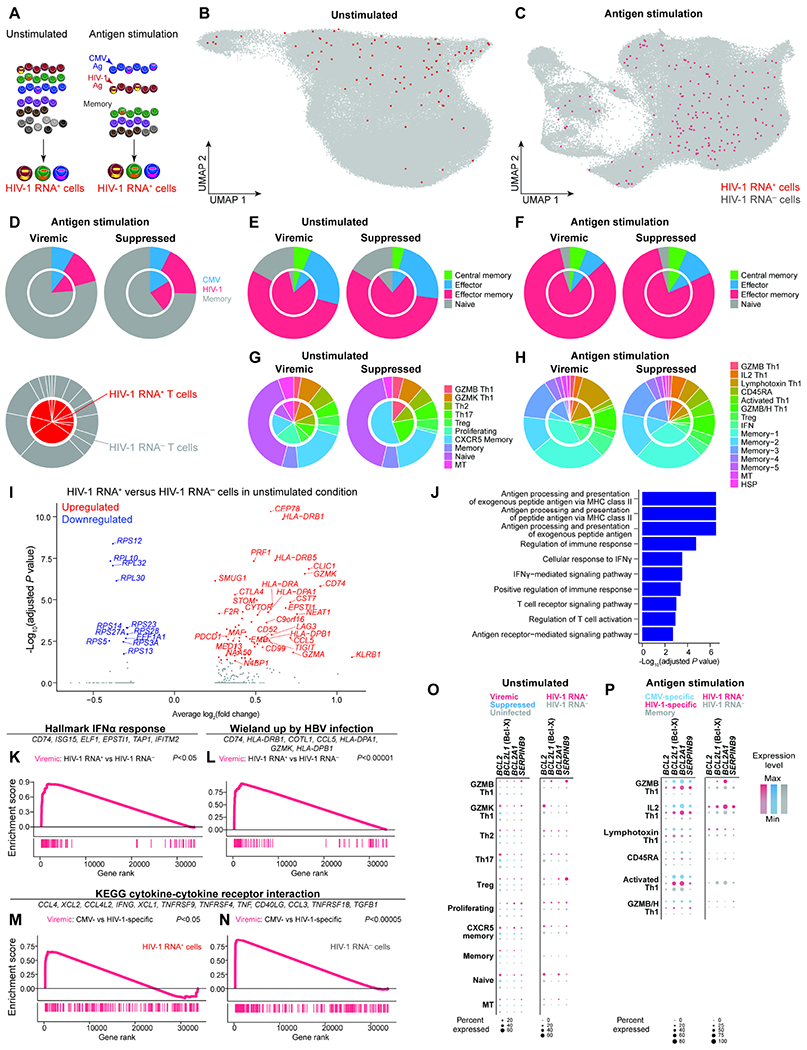
Figure 4. The heterogeneous transcriptional landscape of HIV-1 RNA+ cells demonstrated antigen responses, cytokine responses, and anti-apoptotic programs.

A, Cells expressing HIV-1 RNA were identified by mapping reads to autologous HIV-1 sequences in addition to HXB2 reference sequence in unstimulated conditions and stimulated conditions (including CMV-specific, and HIV-specific, and memory cells). HIV-1 RNA+ cells were defined by having at least 2 HIV-1-related UMI or at least 4 reads of a single UMI to guard against index hopping and sequencing artifacts. B–C, UMAP plots showing HIV-1 RNA+ cells in unstimulated (B), antigen-specific, and memory cells (C). D–H, Pie charts indicating the distribution of antigen specificity (D), memory phenotype in unstimulated (E) and in antigen stimulated conditions (F), transcriptionally defined clusters in unstimulated conditions (G) and in antigen stimulated conditions (H). The inner chart represents HIV-1 RNA+ cells and the outer chart represents HIV-1 RNA− cells. I, Volcano plot indicating differentially expressed genes between HIV-1 RNA+ and HIV-1 RNA− cells in the unstimulated condition during viremia. J, Gene ontology enrichment of immune pathways from upregulated genes. K–N, GSEA plots indicating the enrichment of gene sets in specific immune pathways, including IFNα response (K), viral response (L), cytokine and cytokine receptor interaction (M–N). Representative leading-edge genes are shown in each panel. O–P, Dot plots showing expression of anti-apoptotic Bcl-2 family genes BCL2 (encoding Bcl-2), BCL2L1 (encoding Bcl-xL), and BCL2A1 in unstimulated (O) and antigen stimulated conditions (P). See also Figure S5, Figure S6, and Table S3.
