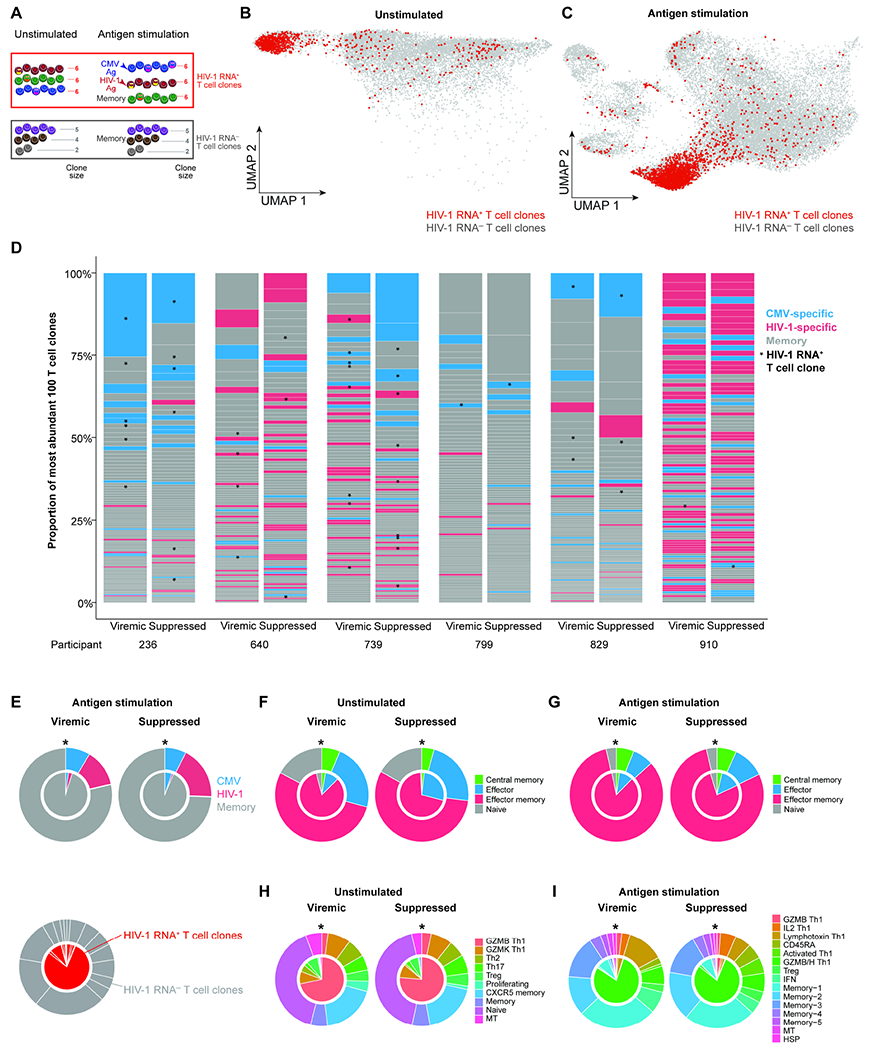
Figure 5. HIV-1 RNA+ T cell clones are enriched in effector memory and GZMB+ Th1 cells.

A, T cell clones were defined by at least two cells sharing the same TCR sequence. HIV-1 RNA+ T cell clones were defined by T cell clones having at least one HIV-1 RNA+ cells. HIV-1 RNA− T cell clones were defined by T cell clones not having any HIV-1 RNA+ cells. B–C, UMAP plots indicating HIV-1 RNA+ T cell clone in unstimulated (B) and antigen stimulated conditions (C). D, The largest 100 T cell clones, as measured by bulk TCR sequencing in each participant at each time point. * in D, HIV-1 RNA+ clones. E–I, Pie charts indicating the distribution of antigen specificity (E), memory phenotype in unstimulated (F) and in antigen stimulated conditions (G) transcriptionally defined clusters in unstimulated conditions (H) and in antigen stimulated conditions (I). * in E–I, P < 0.05, Fisher’s exact test. See also Table S4, Figure S5 and Figure S6.
