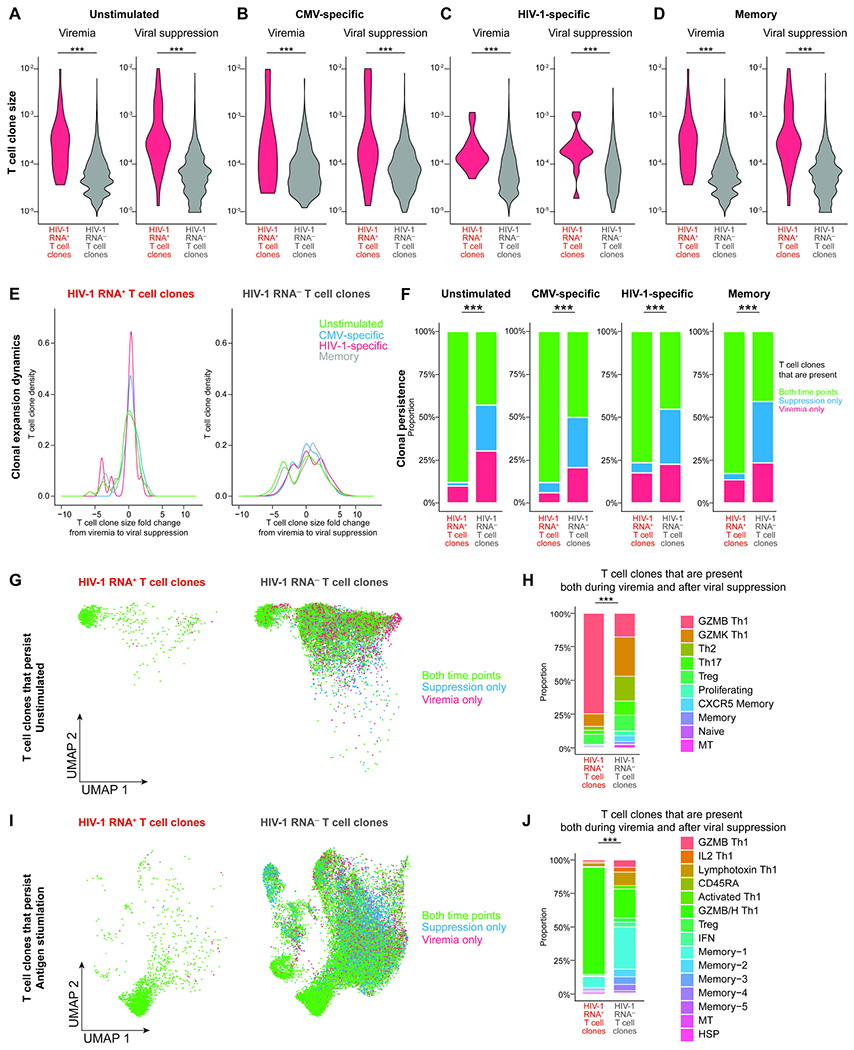
Figure 6. HIV-1 RNA+ T cell clones are large and persistent in GZMB and GZMB/H Th1 cells.

A–D, T cell clone size, as measured by the frequency of T cells sharing the same TCR sequence, in unstimulated (A) and antigen stimulated conditions in CMV-specific (B), HIV-1-specific (C), and memory cells (D). P values were determined by the Wilcoxon rank-sum test. E, T cell clonal expansion dynamics, as measured by the fold change of T cell clone size from viremia to viral suppression. F, T cell clonal persistence, as measured by the proportion of T cell clones that can be captured both during viremia and after viral suppression versus those that can be captured at one time point. G and I, UMAP plots showing T cell clones that persisted both during viremia and after viral suppression in unstimulated (G) and antigen-stimulated conditions (L). H and J, the proportion of transcriptionally defined T cell clusters in T cell clones that persisted both during viremia and after viral suppression in unstimulated (H) and antigen-stimulated (J) conditions. In F, H, and J, P values were determined by Fisher’s exact test. ***, P <0.001. See also Figure S6.
