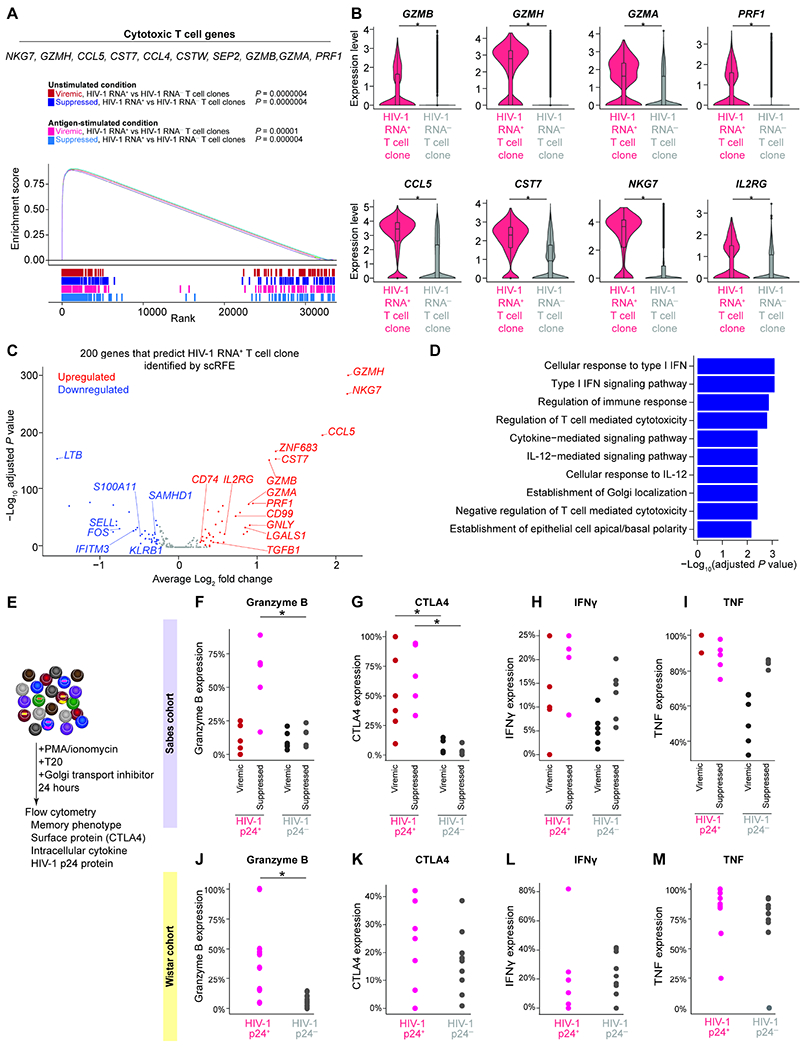
Figure 7. HIV-1 RNA+ T cell clones are enriched in effector memory CD4+ T cells and express cytotoxic T cell genes.

A, GSEA plot and example leading-edge genes (the top genes enriched in this pathway) showing enrichment of gene expression in T cell activation genes (GSE45739 unstimulated versus anti-CD3/CD28 stimulated CD4 T cell upregulated) in HIV-1 RNA+ T cell clones. B, Expression level of cytotoxic T cell response genes. P values were derived from Wilcoxon rank-sum test. C, The 200 genes necessary and sufficient to differentiate HIV-1 RNA+ T cell clone from HIV-1 RNA−T cell clone were identified using single-cell identity definition using random forests and recursive feature elimination (scRFE). The volcano plot showed differential expression of the 200 scRFE defined genes. P values were derived from Wilcoxon rank-sum test. D, Enriched immune pathways of upregulated genes among the 200 genes necessary and sufficient to differentiate HIV-1 RNA+ T cell clone from HIV-1 RNA−T cell clones. P values were calculated by Fisher’s exact test. E, To validate whether the enrichment of HIV-1 RNA+ cells in GZMB+, CTLA4+, and effector memory populations at the protein level, we stimulated CD4+ T cells with PMA and ionomycin in the presence of ART (T20) and Golgi transport inhibitors for 24 hours. We then measured HIV-1 p24 protein expression, memory markers, granzyme B, CTLA4, IFNγ, and TNF protein expression in the Sabes cohort (F–I) and the Wistar cohort (J–M). Study participants in these two cohorts were significantly different in the duration of viral suppression, age, ethnicity, and geographic locations. P values were derived from Wilcoxon rank-sum test. *, P <0.05; ***, P <0.001. See also Figure S7 and Table S4.
