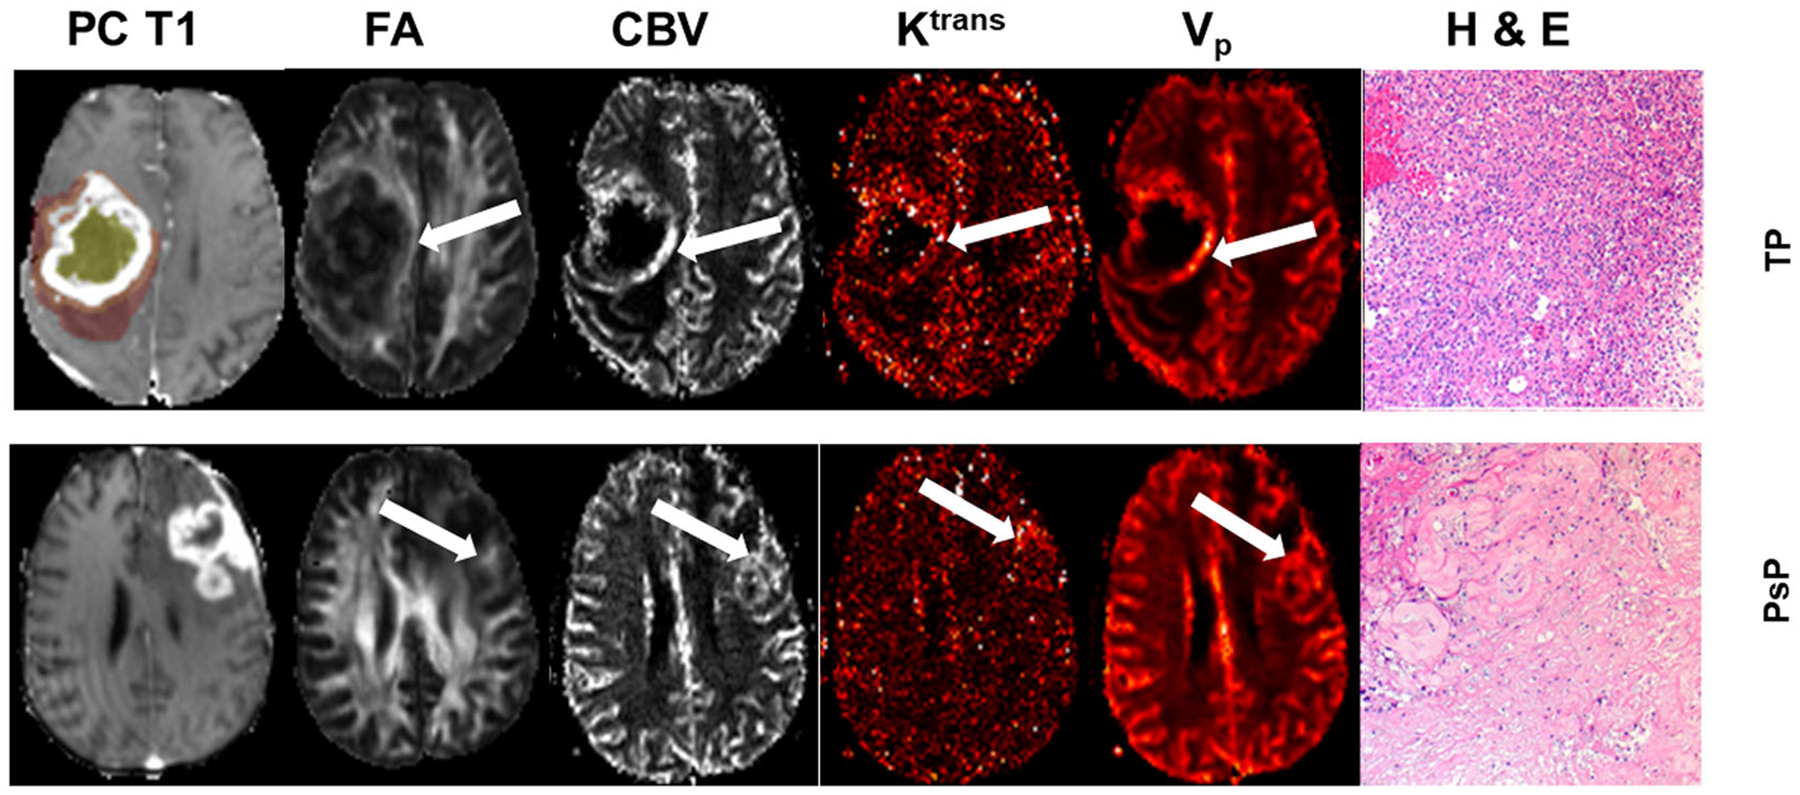
FIGURE 5.

Axial postcontrast T1 (PC-T1)-weighted image from a patient with true progression (TP) (top row), demonstrating a neoplasm in the right parietal region infiltrating into the lateral ventricles. The regions of interest are overlaid on the image, with the colors indicating the following defined regions: white, contrast-enhancing region; yellow, central core; orange, immediate peritumoral region; and brown, distal peritumoral region. Fractional anisotropy (FA), cerebral blood volume (CBV), volume transfer constant (Ktrans), and volume fraction of plasma space in tissues (Vp) values from the enhancing regions (arrows) in TP are higher than those of pseudoprogression (PsP) (bottom row). A photomicrograph of hematoxylin–eosin (H & E) stain from the TP case demonstrates areas of high tumor cellularity, pseudopalisading necrosis, endothelial proliferation, and increased mitotic activity, whereas PsP shows predominant treatment-related changes, including extensive geographic necrosis and vascular fibrinoid necrosis
