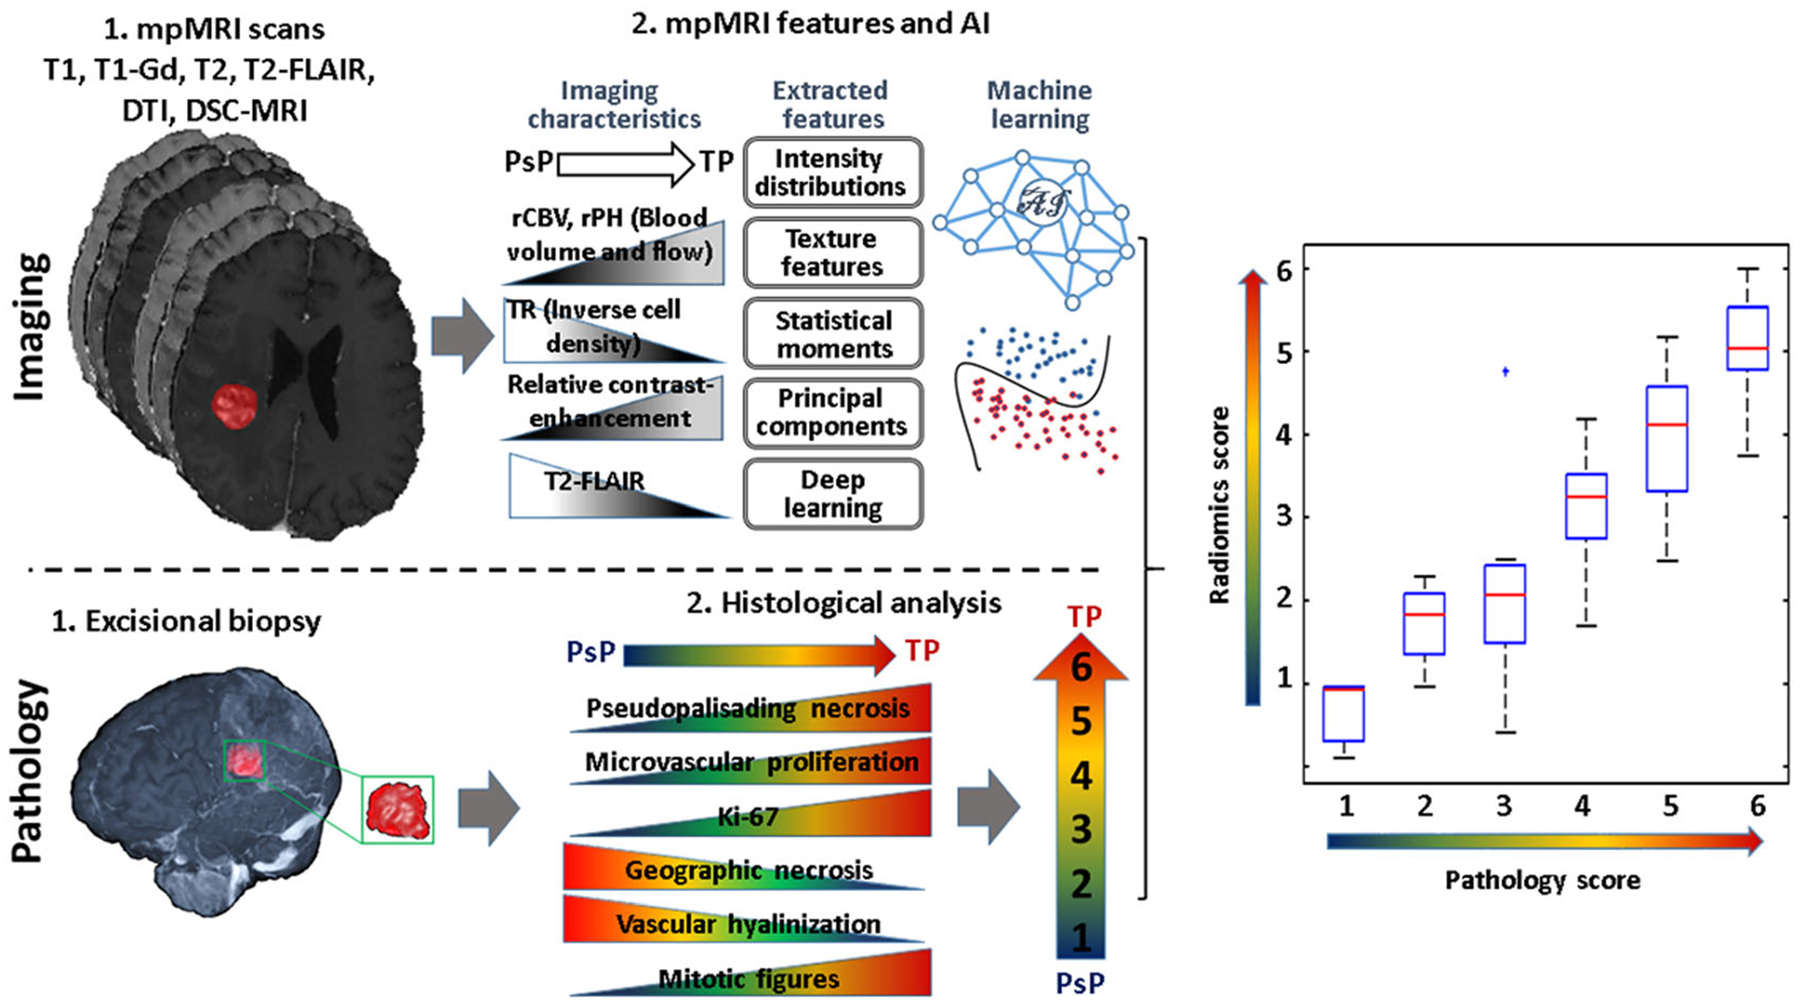
FIGURE 7.

Processing pipeline of the artificial intelligence radiographic biomarkers and histopathologic analyses. Top row (imaging): (1) multiparametric (mp) MRI scans: T1-weighted precontrast and postcontrast, T2-weighted, T2 fluid-attenuated inversion recovery (T2-FLAIR), diffusion tensor imaging (DTI), dynamic susceptibility contrast (DSC)-MRI and defining the resected tissues; (2) defining the resected enhancing tissues after registration of the preoperative with postoperative images using Deformable Registration Attribute Matching and Mutual-Saliency weighting (DRAMMS) software. Features are extracted from each region, quantifying intensity, shape, principal component analysis, statistics, and texture. Machine learning analysis is performed. Bottom row (pathology): (1) excisional biopsy; (2) histological characteristics and defined pathology scores from resected tumor specimen. Right panel: a plot showing a correlation between pathology scores and imaging scores via artificial intelligence (radiomics scores)
