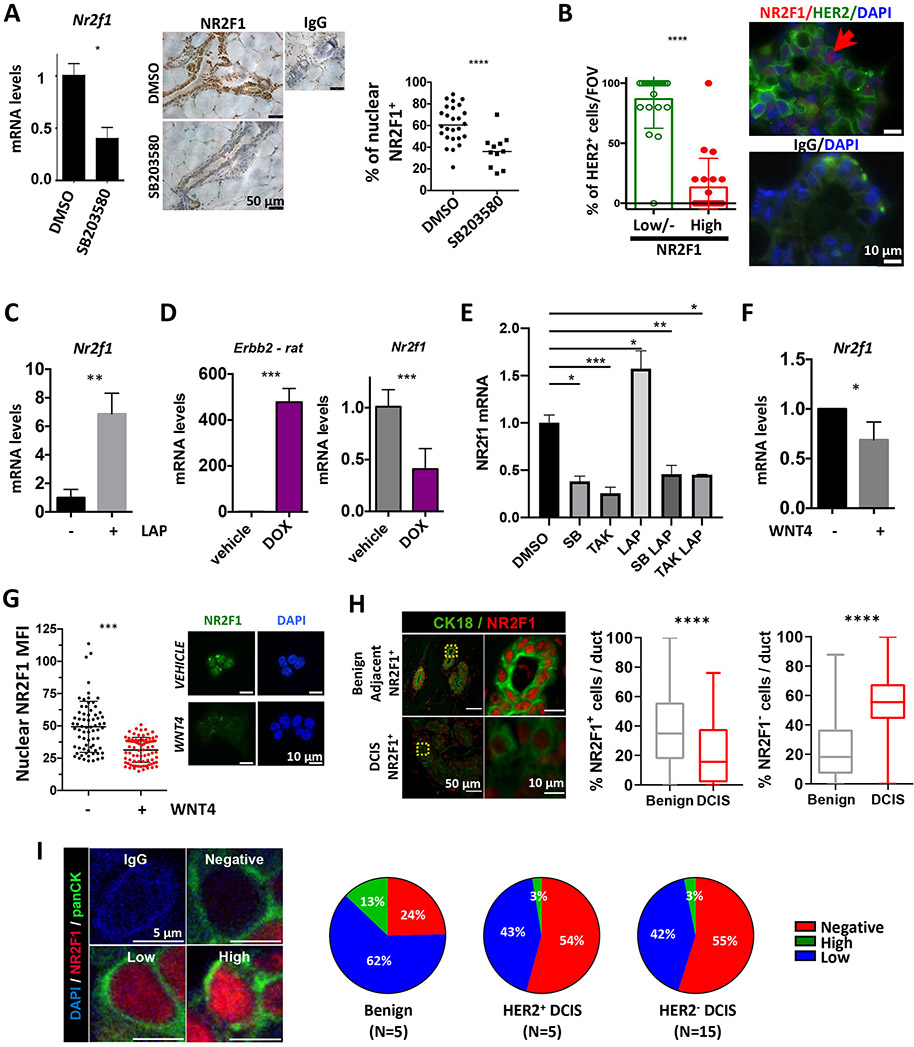
Figure 1. NR2F1 is downstream of p38 and HER2 signaling in ECCs.
A. QPCR and percentage of cells/duct with nuclear NR2F1 shown by IHC from mammary glands of MMTV-HER2 females treated with SB203580. N=2 mice/condition. B. Percentage of HER2 positive+ cells per field of view (FOV) that has either NR2F1HIGH or NR2F1LOW/NEGATIVE expression in young MMTV-HER2 mammary glands by IF. 21 random fields, N=2 mice/condition. C. QPCR for Nr2f1 in MMTV-HER2 ECC sphere cultures treated with Lapatinib. N=3. D. QPCR for Erbb2 and Nr2f1 in acini derived from MMTV-rtTA/TetO-NeuNT MECs after DOX induction. N=2. E. QPCR for Nr2f1 in MMTV-HER2 ECCs in 2D after treatment with SB203580 or TAK715, alone or in combination with Lapatinib. N=2. F&G. Nr2f1 expression by QPCR (F) and IF (G) in MMTV-HER2 ECC after treatment with rWNT4. N=2. H&I. IF for CK18 and NR2F1 in 20 DCIS patients. Percentage of nuclear NR2F1+ and NR2F1− cells/duct is shown (H). Percentage of cells with nuclear NR2F1HIGH, NR2F1LOW and NR2F1NEGATIVE per duct/lesion in DCIS HER2+ or HER2− samples (I). For all graphs, mean (dotplot) or mean±SD (bar graphs) is shown and student’s unpaired t- test, except A, B&G Mann-Whitney test and H Fisher’s exact test.

