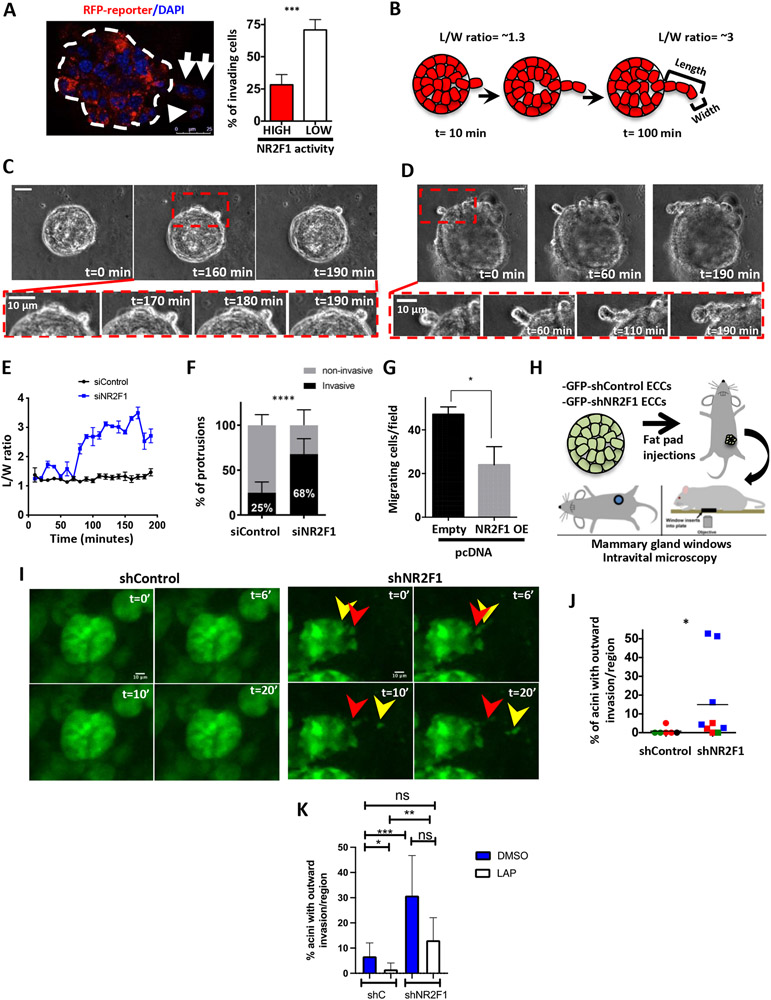
Figure 2. NR2F1 inhibits MMTV-HER2 ECCs invasion.
A. Percentage of invading cells with high/low NR2F1 reporter activity in acini by IF. Arrows show invading cells. B. Schematic of invasive protrusions and length-over-width (L/W) ratio. C&D. Time lapse imaging of siControl (C) or siNR2F1 (D) acini. E. L/W ratio of protrusions in siControl (black) or siNr2f1 (blue) acini. F. Percentage of invasive and non-invasive protrusions in siControl and siNr2f1 in acini. N=2. Fisher’s exact test. G. Migration assay for NR2F1-overexpressing or empty vector control MMTV-HER2 ECCs. N=2. H. Schematic of intravital imaging using mammary gland windows (Adapted[19]). I&J. Percentage of acinar structures with outward invasion (J) by intravital imaging (I) in mice orthotopically injected with shControl or shNr2f1 MMTV-HER2 ECCs. N=3-4mice/group (colored). K. Percentage of acinar structures with outward invasion by intravital imaging in mice injected with same cells as in J and treated with lapatinib for 48 h. N=2-4 mice/group. For all graphs, mean (dotplot) or mean±SD (bar graphs) is shown and student’s unpaired t- test, Mann-Whitney test (for J&K), unless otherwise noted.

