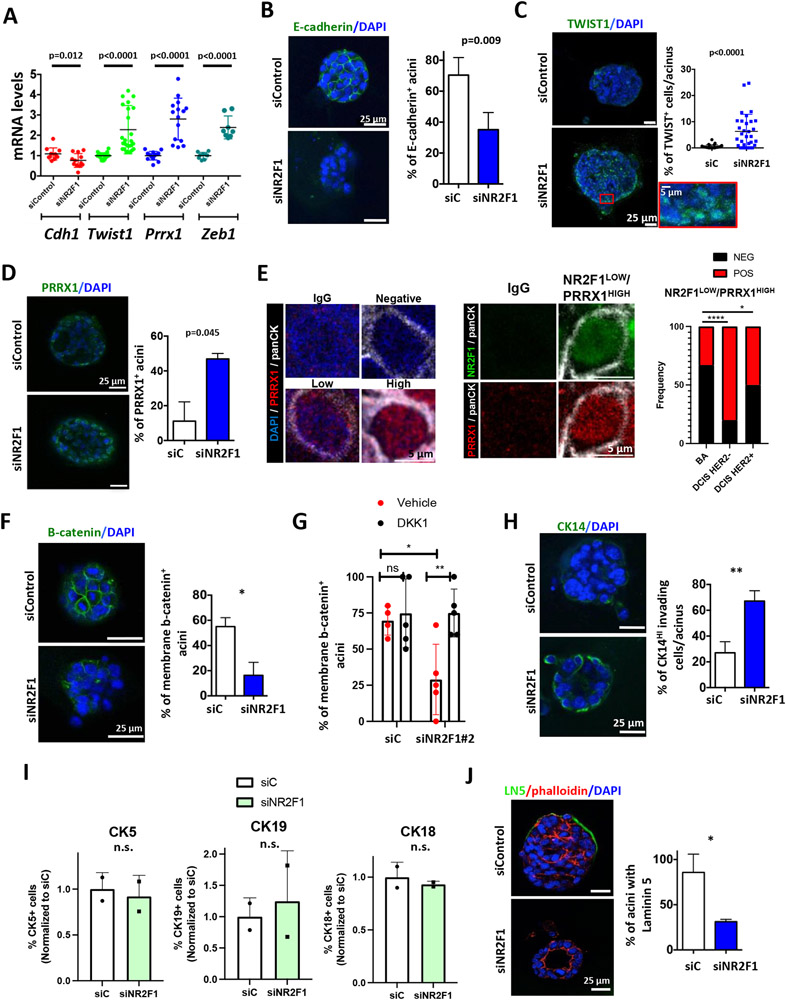
Figure 3. NR2F1 depletion allows a partial EMT and hybrid luminal/basal program in MMTV-HER2 ECC acini.
A. QPCR for the indicated genes in siControl vs. siNr2f1 MMTV-HER2 ECC acini. N=3-9. B. Percentage of E-cadherin+ acini by IF. N=3. C. Percentage of TWIST1+ cells per acinus. N=2. D. Percentage of PRRX1+ acini by IF. N=2. E. IF staining for NR2F1 (green), PRRX1 (red) and panCK (gray) in HER2− (n=6), HER2+ (n=7) and benign adjacent (n=6) DCIS samples. Representative images for PRRX1 levels are shown (left). Representative cell with NR2F1LOW/PRRX1HIGH signature is shown (middle). Fisher’s exact test. F. Percentage of β-catenin+ MMTV-HER2 ECC acini by IF after transfection with siRNA. N=2. G. Percentage of β-catenin+ acini after transfection with siNr2f1#2 and treatment with rDKK1. N=2. H. Percentage of CK14+ invading cells per acinus. N=2. I. Luminal and basal marker expression by FC in acini from freshly isolated MMTV-HER2 ECCs. N=2. J. Percentage of laminin V+ acini by IF. N=2. For all graphs, mean (dotplot) or mean±SD (bar graphs) is shown and student’s unpaired t- test, unless otherwise noted.

