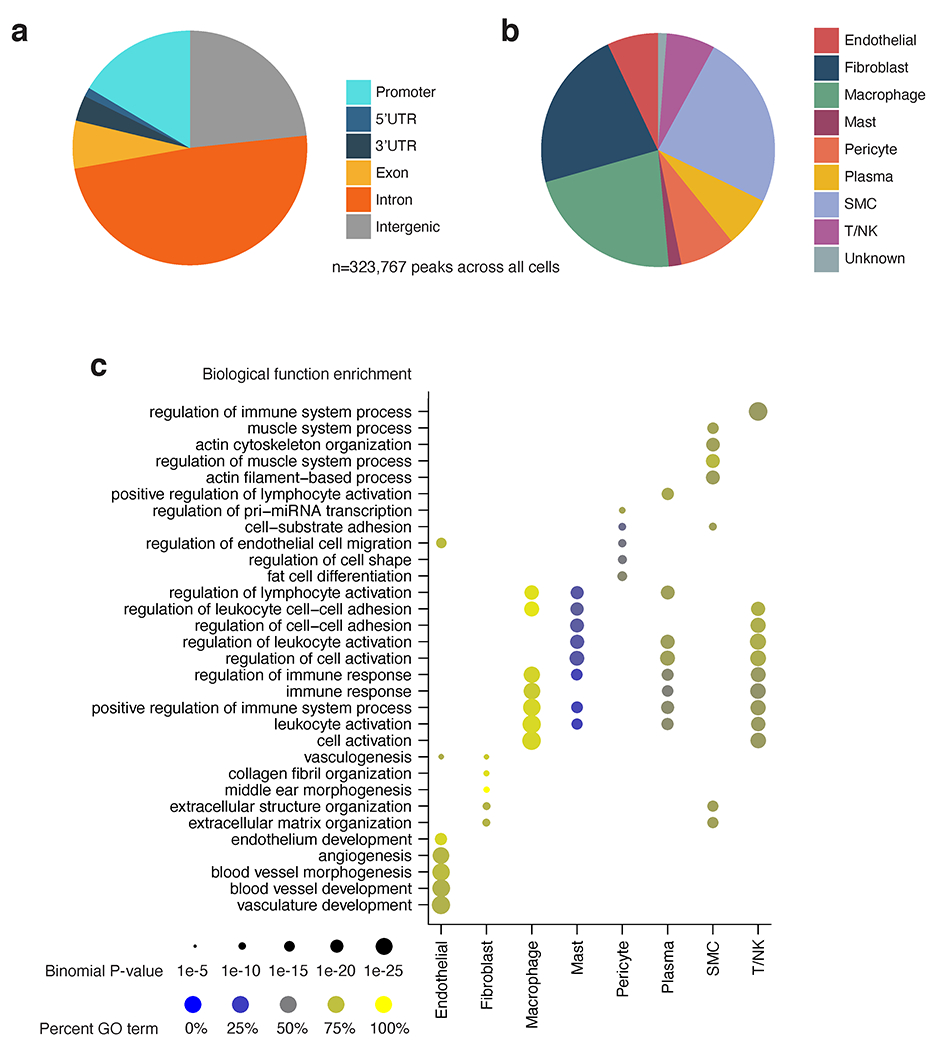
Extended Data Fig. 4.

Coronary artery snATAC peak cell type and functional annotation. (a) Pie chart showing genomic annotations of the consensus set of coronary peaks across all cell types (n=323,767). Peaks were annotated using the ChIPseeker R/Bioconductor package (Yu et al. Bioinformatics 2015). (b) Pie chart of cell type annotation for peaks in the consensus peak set (n=323,767) according to ArchR (Granja et al. Nature Genetics 2021). Peaks were annotated with a cell type according to the group from which each peak originated according to ArchR’s iterative overlap procedure. (c) Functional enrichment analysis of cell type marker peaks using GREAT.
