Extended Data Fig. 8.

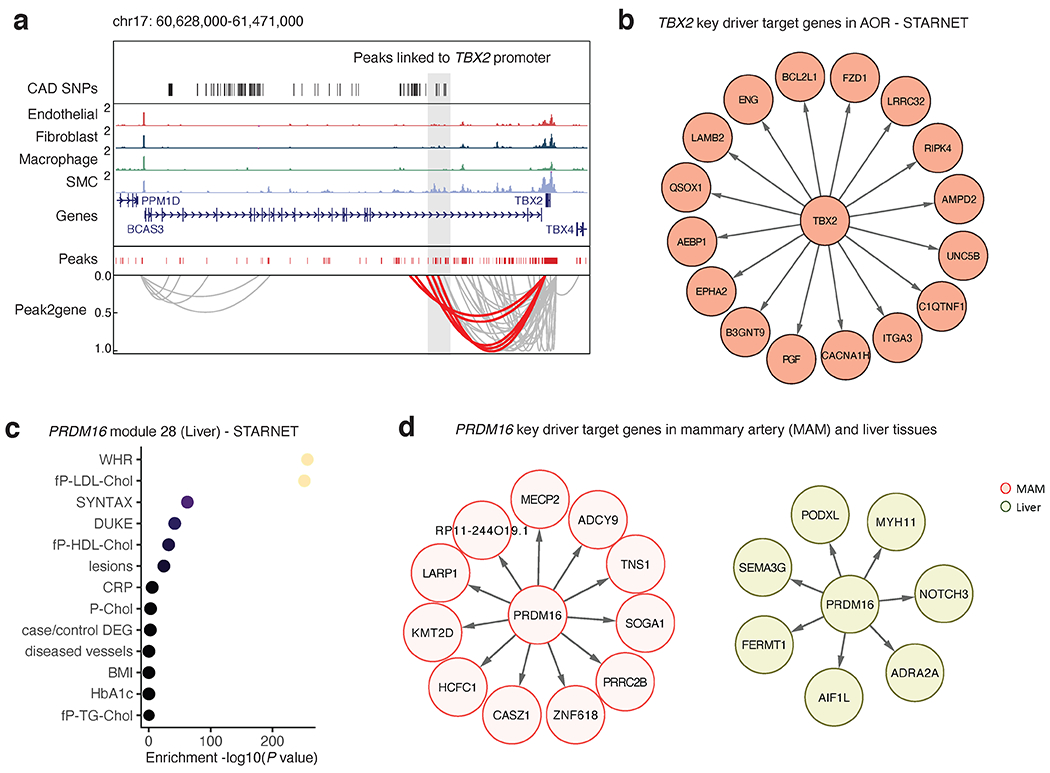
Co-accessibility and gene regulatory analyses prioritize transcriptional regulators TBX2 and PRDM16. (a) Genome browser track highlighting the association between CAD associated SNPs and SMC marker genes through co-accessibility (peak2gene) detected by snATAC-seq data (Methods). The red loops represent the association between TBX2 promoter and CAD associated SNPs. (b) Network visualization of TBX2 key driver target genes in STARNET atherosclerotic aortic root (AOR) tissue. (c) Clinical trait enrichment for PRDM16 module 28 in STARNET liver tissue. Pearson’s correlation p-values (gene-level) were aggregated for each co-expression module using a two-sided Fisher’s exact test. Case/control differential gene expression (DEG) enrichment was estimated by a hypergeometric test. (d) Network visualization of PRDM16 key driver target genes in STARNET mammary artery (MAM) and liver tissues.
