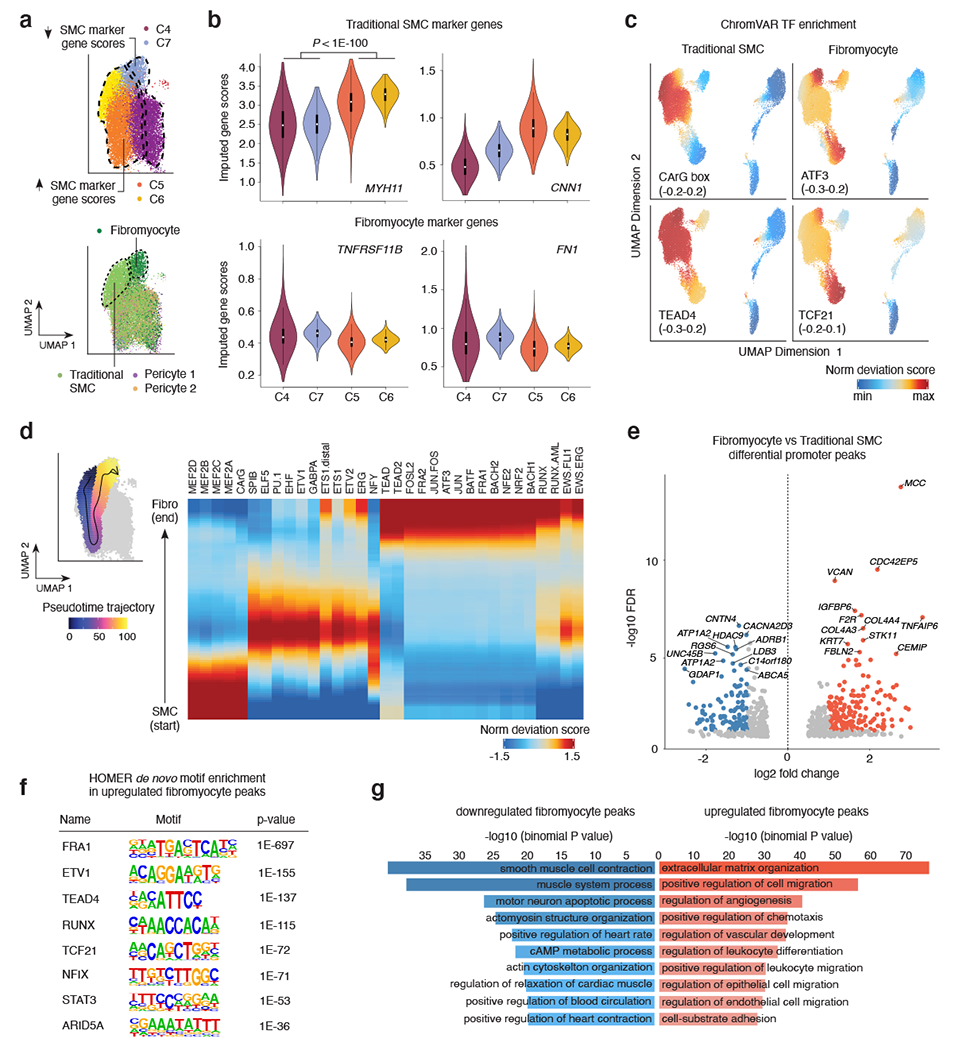
Figure 3. Sub-cluster analysis of smooth muscle cell accessible chromatin identifies fibromyocyte regulatory programs.

(a) snATAC UMAP for the 4 SMC clusters (C4-C7). The UMAP was colored by snATAC cluster (top) and by cell type labels assigned by scRNA-seq label transfer (bottom). Dashed lines demarcate boundary of cells with increased SMC marker gene scores (clusters C5 and C6), or decreased SMC marker gene scores (C4 and C7). Integrated snATAC/scRNA UMAP highlights both Fibromyocyte SMCs and traditional SMCs (demarcated by dashed lines and colors) within clusters 4-7. “Pericyte 1” and “Pericyte 2” labels from scRNA-seq were also mixed in clusters 4 and 5. (b) Quantification of imputed snATAC gene scores highlights higher chromatin accessibility at differentiated SMC marker genes MYH11 and CNN1 in clusters 5 and 6, and higher accessibility at modulated SMC/Fibromyocyte marker genes TNFRSF11B and FN1 in clusters 4 and 7. P-values were calculated using a one-sided Wilcoxon test. The exact P-values are as follows: MYH11: p=0; CNN1: p=0; TNFRSF11B: p=0; FN1: p=1.7e-260. The N values for nuclei in each cluster are as follows: C4: 6275; C7: 1971; C5: 6134; C6: 1988. (c) ChromVAR transcription factor motif enrichment for differentiated SMC CArG box in traditional SMC and enrichment for ATF3 and TCF21 motifs in modulated SMC/Fibromyocyte and Fibroblast clusters. The TEAD4 motif is enriched in both contractile and modulated SMCs. (d) Left, scatter plot overlay of SMC UMAP depicts the trajectory path from differentiated SMC to modulated SMC/Fibromyocyte sub-clusters (left). Motif enrichment heatmap shows the top enriched motifs across the trajectory pseudo-time (right). Values represent accessibility gene z-scores. (e) Volcano plot of differential peak analysis (subset to promoter peaks) comparing Fibromyocyte and traditional SMCs. Fibromyocyte and SMC annotated cells were defined based on RNA label transferring (Methods) and significant peaks determined by a Wilcoxon-test as implemented in ArchR. Peaks with significant differences at FDR <= 0.05 and Log2 fold change > 1 were colored light red (Fibromyocyte upregulated) and blue (Fibromyocyte downregulated). (f) Top enriched motifs within the total upregulated Fibromyocyte peaks (5,681) detected using HOMER de novo enrichment analysis with the hypergeometric distribution test. P-values shown are unadjusted for multiple comparisons. (g) Functional annotation of Fibromyocyte upregulated (light red) and downregulated (blue) peaks conducted using GREAT with the binomial distribution test. Top enriched biological processes functional terms are listed. P-values shown are unadjusted for multiple comparisons.
