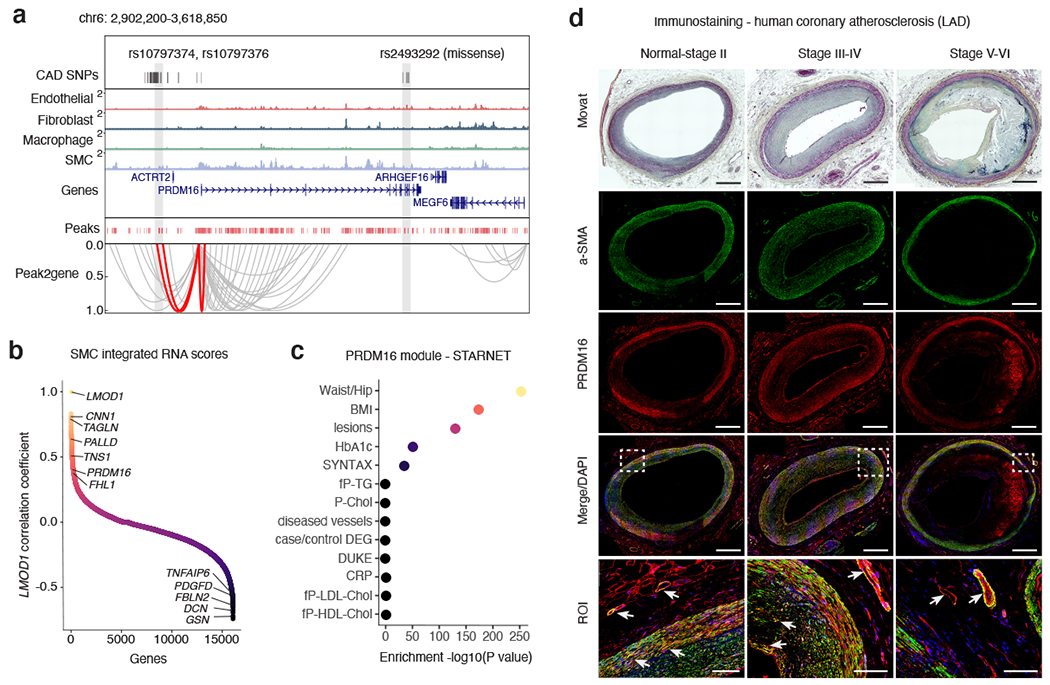
Figure 6. PRDM16 is a CAD-associated key driver transcriptional regulator in SMCs.

(a) Genome browser track highlighting the association between CAD associated SNPs and SMC marker genes through co-accessibility (peak2gene) detected by snATAC-seq data (Methods). The red loops represent the association between PRDM16 promoter and CAD associated SNPs. (b) Correlation coefficients of snATAC/scRNA integration scores gene expression levels between LMOD1 and genome-wide coding genes in SMCs. Genes were ranked by Pearson’s correlation coefficient with LMOD1. Representative positive and negative correlated SMC gene names are labeled. (c) Clinical trait enrichment for PRDM16 containing module in subclinical mammary artery in STARNET gene regulatory network datasets. Pearson’s correlation p-values (gene-level) were aggregated for each co-expression module using a two-sided Fisher’s exact test. Case/control differential gene expression (DEG) enrichment was estimated by a hypergeometric test. (d) Movat pentachrome staining and PRDM16 (red) and alpha-smooth muscle actin (a-SMA) (green) immunofluorescence staining of atherosclerotic human coronary artery segments - left anterior descending (LAD) from normal-Stage I, Stage III-IV, and Stage V-VI lesions based on Stary classification stages. Whole slide images captured from 20x confocal microscopy stitched tiles. PRDM16/a-SMA co-staining (see arrows) depicted in yellow from merged images. DAPI (blue) marks nuclei. n = 4 per group. Scale bar = 1 mm, except for region of interest (ROI): scale bar = 100 μm.
