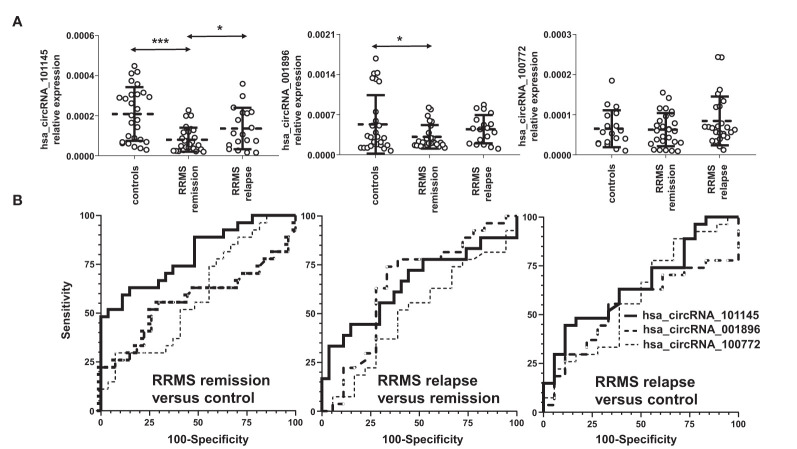
Figure 2.
Validation of the differential downregulation of the selected circRNAs in RRMS. (A) The expression levels of the indicated circRNAs were analyzed via qRT-PCR. Significance was determined by analysis of variance (ANOVA) with the Scheffé post-hoc test. *P < 0.05, ***P < 0.0005. The dotted line represents the mean value ( ± SD). (B) Receiver operating characteristic (ROC) curves for the comparison of hsa_circ_101145, hsa_circ_001896, and hsa_circ_100772 expression levels in RRMS relapse versus control, RRMS remission versus control, and RRMS relapse versus remission.

