Figure 4.
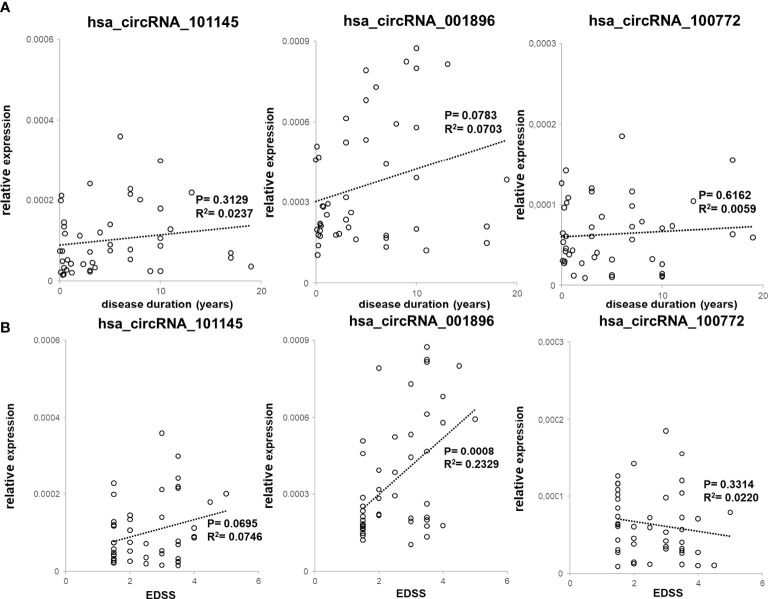
Correlation between downregulated circRNA levels with clinical RRMS parameters. (A) PBMC hsa_circRNA_101145, hsa_circRNA_001896, and hsa_circRNA_100772 expression levels were plotted against disease duration. Circles represent individual data, and the line represents a correlation trend; P-values were calculated by R 2 statistic. (B) PBMC hsa_circRNA_101145, hsa_circRNA_001896, and hsa_circRNA_100772 expression levels were plotted against EDSS. Circles represent individual data, and the line represents a correlation trend; P-values were calculated by R 2 statistics.

