FIGURE 3.
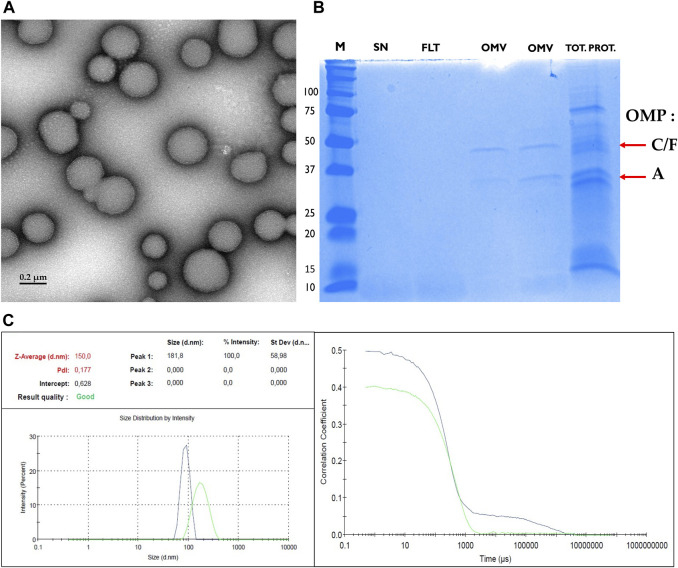
Biophysical characterization of OMVs. (A) Transmission electron microscopy image of purified E. coli outer membrane vesicle (OMV) showing size and morphology. Scale bar, 200 nm. (B) Coomassie blue-stained SDS-PAGE of OMVs from cultures of E. coli K12 MG1655 shows successful purification of OMVs depleted from cellular debris. From left to right we illustrate the molecular weight ladder (M, in kDa), the supernatant (SN), the filtrate (FLT), two samples of OMV: the first being isolated using ultracentrifugation approach and the second using the Exobacteria kit, and at the very right the total protein fraction (TOT. PROT.). The successful enrichment of OMVs with the ultracentrifugation or the Exobacteria kit was confirmed by the presence of two bands which were verified to correspond to the major Outer Membrane Proteins (OMPs) and OMV marker proteins OmpF/C (40 kDa) and OmpA (35 kDa) (Horstman and Kuehn, 2000; Daleke-Schermerhorn et al., 2014). The positions of OMPs F, C, and A are indicated by red arrows. (C) Dynamic Light Scattering analysis of the hydrodynamic size of E. coli OMVs. The Intercept value: 0.628 = the signal-to-noise ratio = ideal signal between = (0.6–1); the Polydispersity Index (PdI): 0.177 = diversity of size distribution = indicate if samples are suitable or not: (0.05–07); The Z-average :150 = hydrodynamic parameter insensitive to noise = average size of a particle size distribution.

