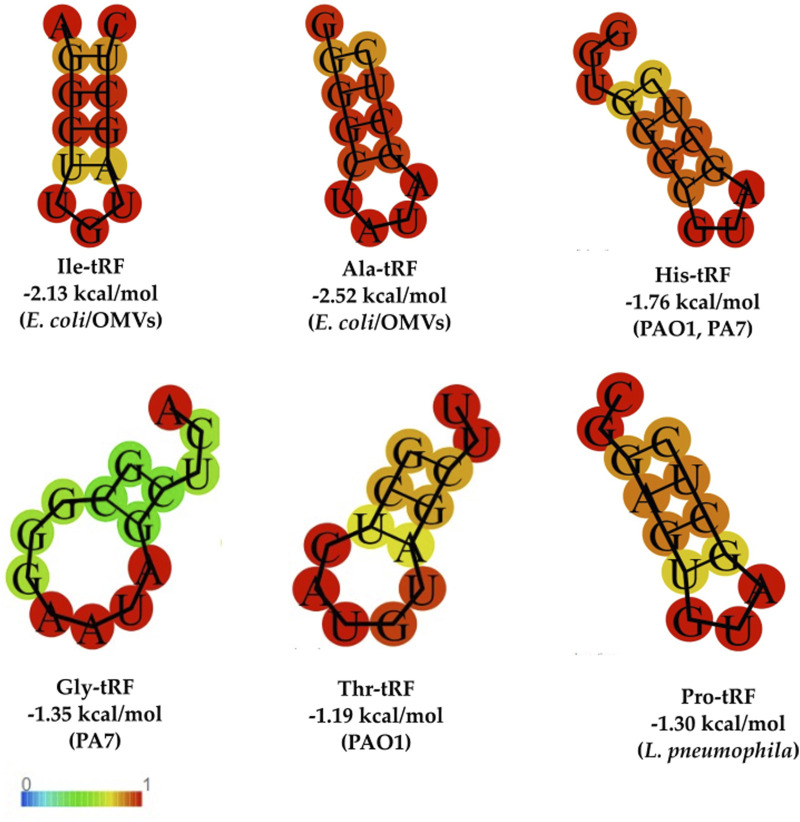
FIGURE 6.
Illustration of the secondary structure of the six most abundant tRFs. RNAfold was used for RNA secondary structure prediction. The values in kcal/mol represent the minimum free energies. The probability of the base pairs is color-coded 0 to 1, with the red color corresponding to higher confidence. All oligonucleotides analyzed have at least 2 G-C base pairs that provide for stem loop stability.

