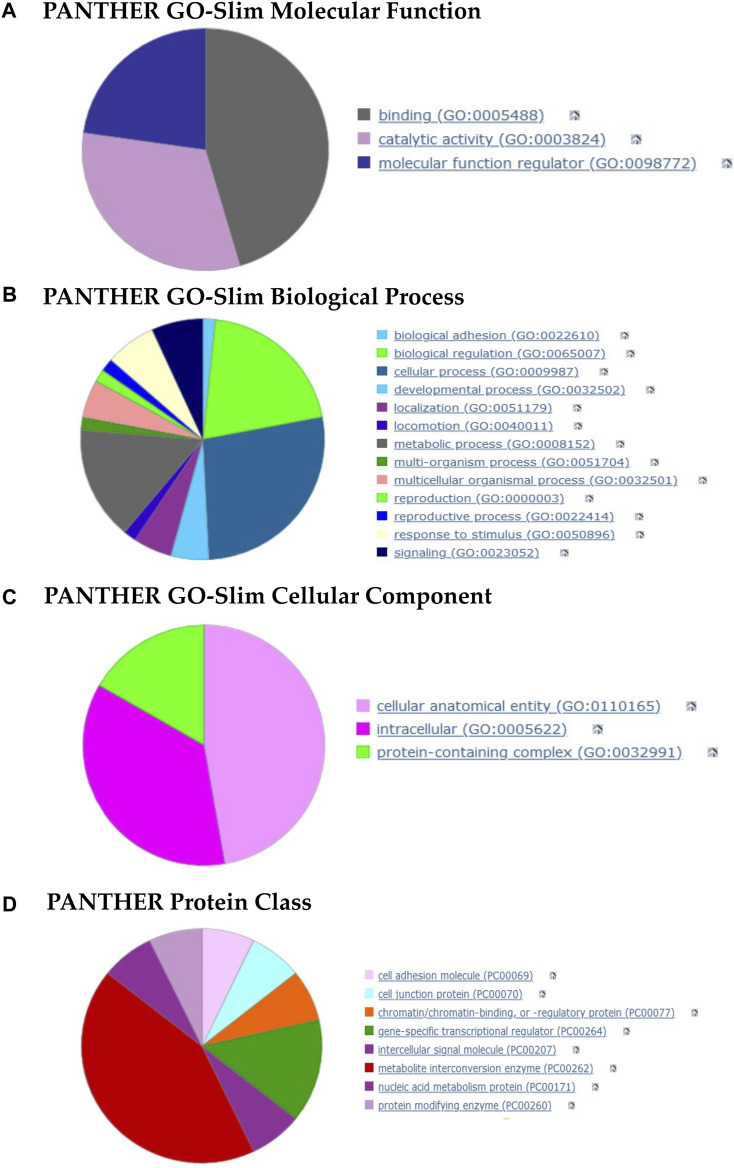
FIGURE 7.
Pie charts of gene function analysis based on the tRFs targets and performed with PANTHER. (A–C) Analysis of the 3 GO aspects (molecular function, biological process, cellular component). (D) PANTHER Index terms describing protein classes (panther classification). The detailed terms for each category are summarized in the Supplementary File SC.

