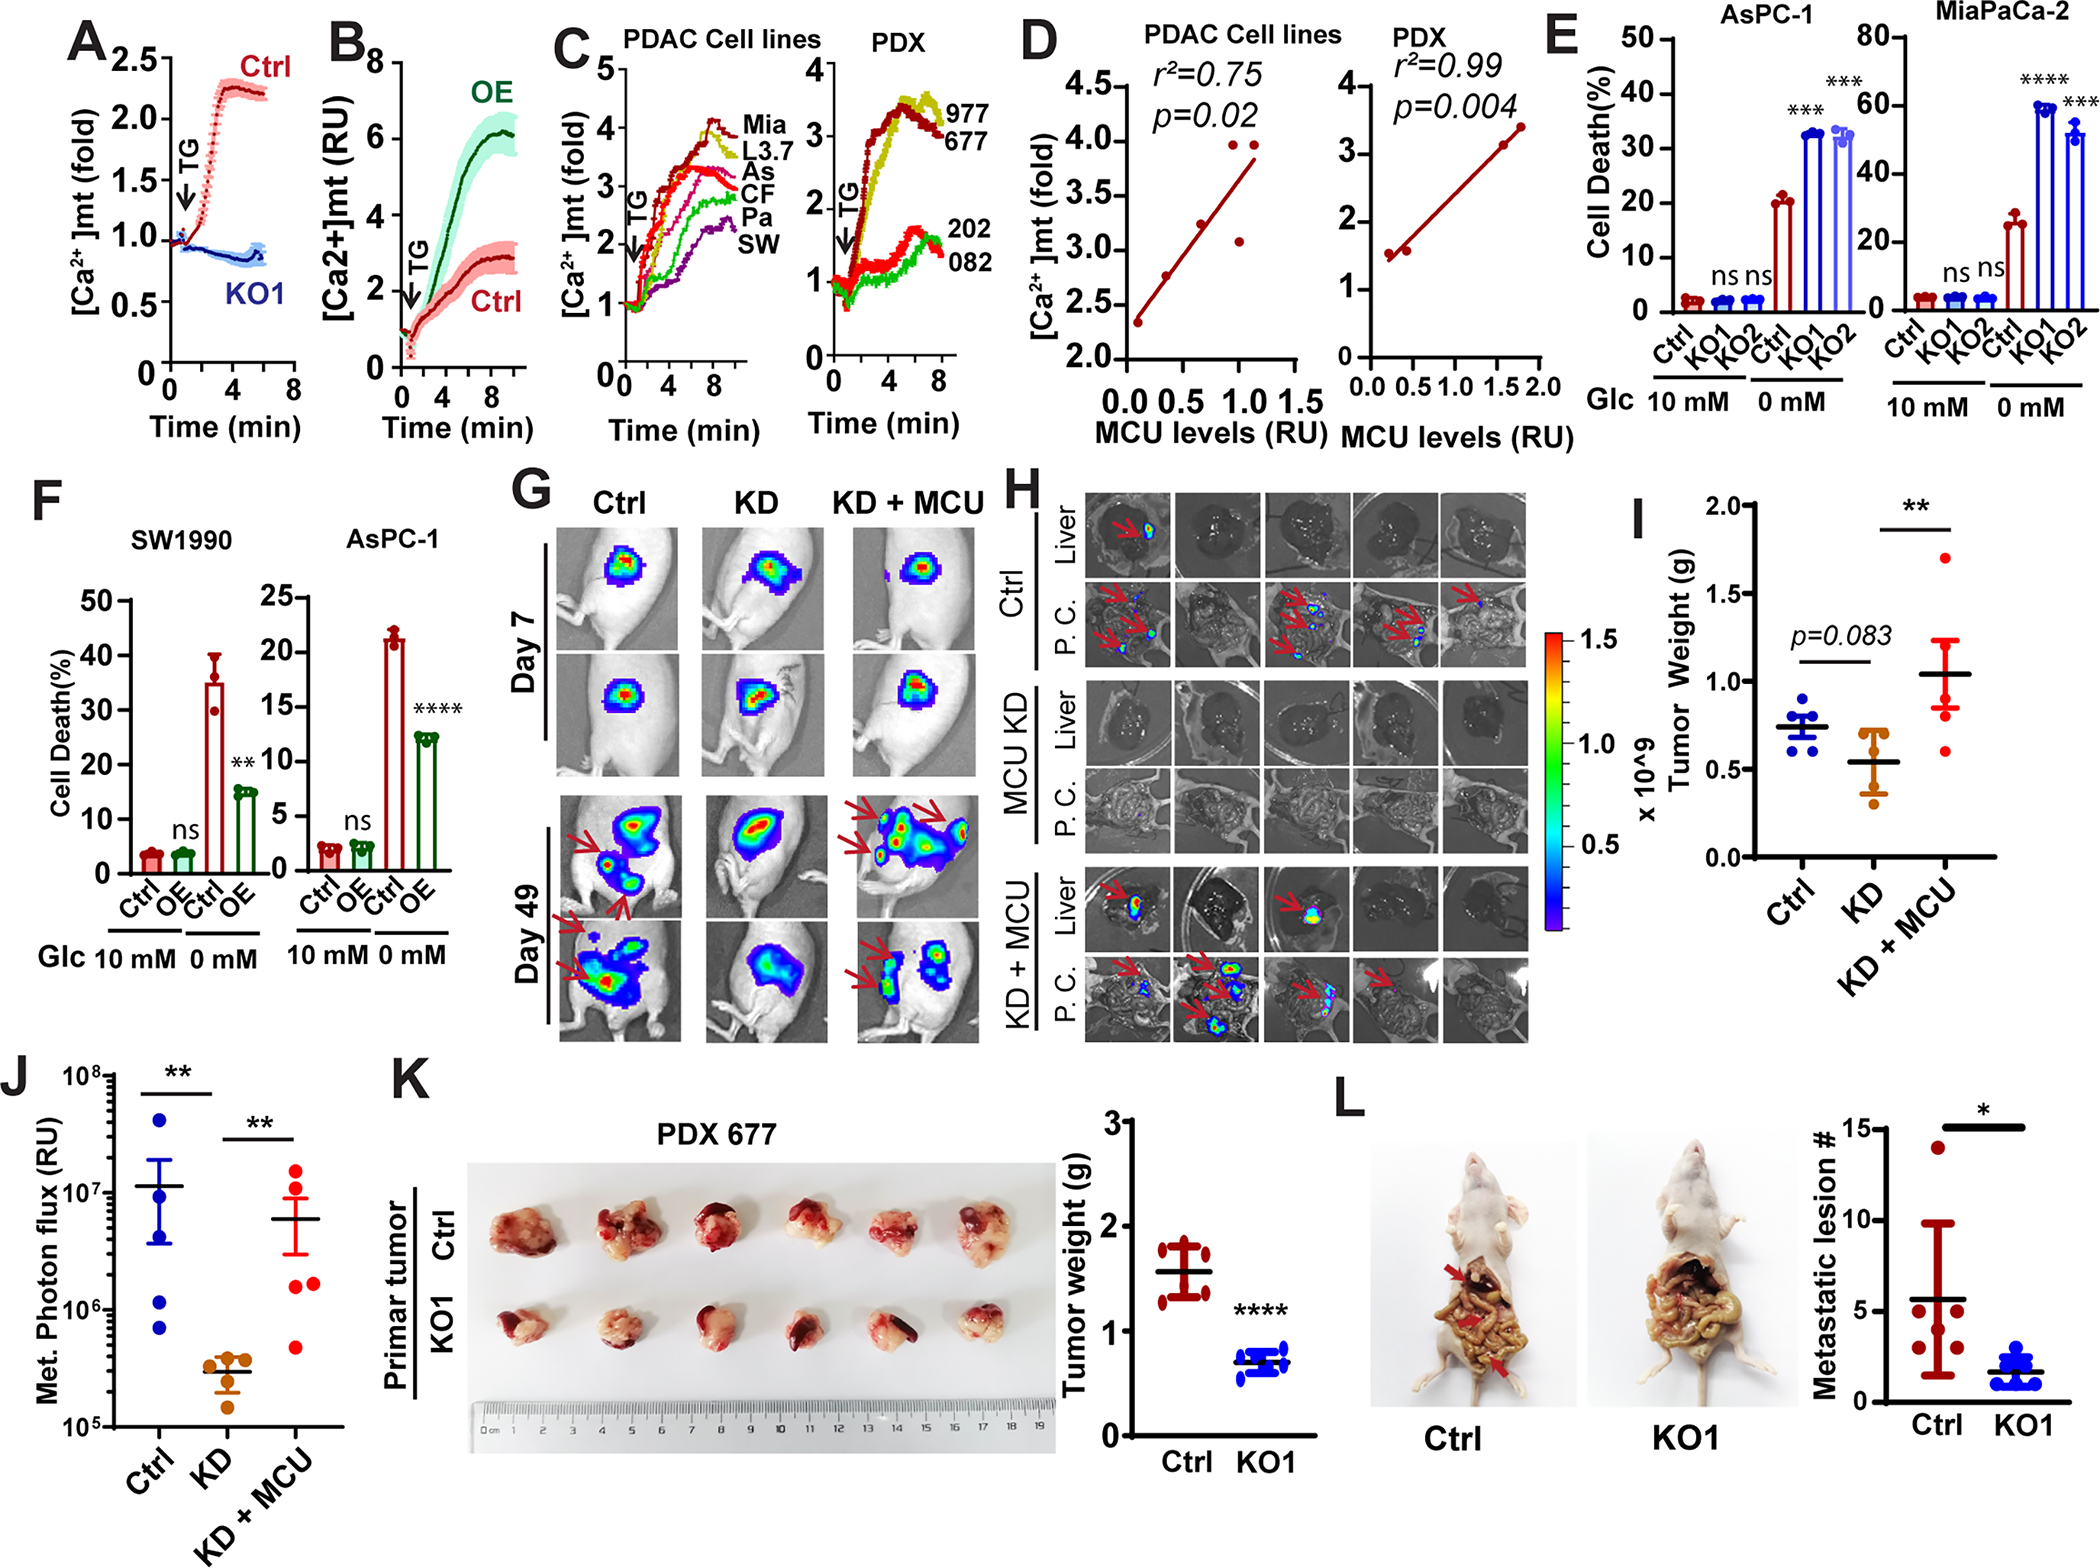
Figure 2. MCU is required for metabolic stress resistance and PDAC metastasis.

A and B, the effects of MCU KO (A) and OE (B) on mitochondrial calcium uptake in Panc-1 cells. Data are shown as mean ± SD from 20–30 cells.
C, the mitochondrial calcium uptake activities in a panel of PDAC cell lines (left panel, MiaPaCa-2, L3.7, AsPC-1, CFPAC-1, Panc-1 and SW1990) or PDX derived cell lines (PDX977, PDX677, PDX202 and PDX082) with different MCU protein expression levels.
D, linear regression to showed the correlation between mitochondrial Ca2+ uptake and protein levels of MCU in PDAC cell lines (left panel) or PDX lines (right panel).
E and F, the effects of MCU KO (E) or OE (F) on PDAC cell death when cultured under glucose replete (10 mM Glc) or glucose deprived (0 mM Glc) conditions.
G-J, the effect of MCU knockdown (KD) and KD + MCU rescue on orthotopic tumor growth and metastasis. G, representative images showing BLI imaging at day 7 and day 49. H, ex vivo BLI imaging showing metastases lesions in the liver and peritoneal cavity (P. C.). I, the weight of tumors harvested from mice implanted with Panc-1 cells. J, quantitation of BLI signals from metastases in the liver and the peritoneal cavity.
K and L, the effects of MCU KO in the MCU-high PDX PDX677 on primary tumor growth (K) and metastasis (L) in a orthotopic metastasis model.
Data in E, F, I, J, K and L were analyzed using two-tailed, two sample unpaired Student’s t-test. ** indicated p<0.01.
