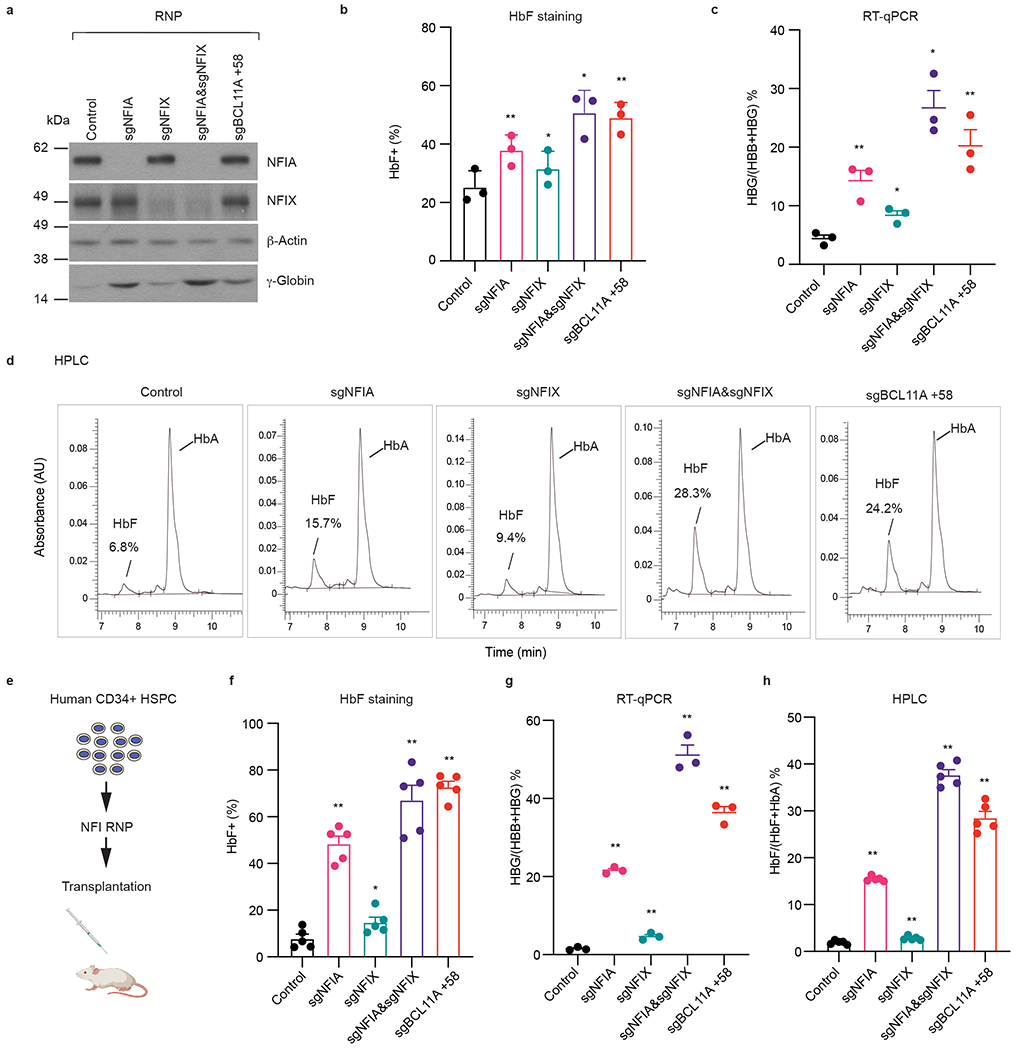
Fig. 2. Co-depletion of NFIA and NFIX reactivates γ-globin in primary adult erythroblasts and xenotransplants.

Frozen G-CSF mobilized human peripheral blood CD34+ hematopoietic stem and progenitor cells (HSPCs) were expanded for three days and transfected with indicated Cas9 and sgRNA RNPs by electroporation. On day 13 of differentiation, a subset of cells was harvested for RNA analysis. On day 15 of differentiation, the remaining cells were subjected to HbF staining, immunoblots, and HPLC analysis. a, Representative immunoblots of NFIA, NFIX, and γ-globin from indicated primary erythroblasts. Experiments were performed with three independent donors with similar results. b, HbF+ fraction (%) of indicated primary erythroblasts as determined by HbF intracellular staining (n = 3 independent donors/biological replicates). Data are expressed as mean ± SEM. * P < 0.05, ** P < 0.01. P values were calculated by comparing indicated samples to control with parametric paired two-tailed Student’s t-test. sgNFIA, P = 0.0099; sgNFIX, P = 0.0119; sgNFIA&NFIX, P = 0.0184; sgBCL11A +58, P = 0.0046. c, The ratio of HBG/(HBG+HBB) of indicated primary erythroblasts as determined by RT-qPCR (n = 3 independent donors/biological replicates). Data are expressed as mean ± SEM. * P < 0.05, ** P < 0.01. P values were calculated by comparing indicated samples to control with parametric paired two-tailed Student’s t-test. sgNFIA, P = 0.0140; sgNFIX, P = 0.0155; sgNFIA&NFIX, P = 0.0119; sgBCL11A +58, P = 0.0049. d, Representative HPLC analysis of fetal hemoglobin (HbF) and adult hemoglobin level (HbA) in indicated primary erythroblast cells. Experiment was performed with one donor. e-h, Human CD34+ HSPCs were electroporated with RNPs targeting negative control sequence, indicated NFI genes, or the BCL11A +58 enhancer. Control and NFI RNP edited cells were transplanted into NBSGW (NOD, B6. SCID Il2rg−/−KitW41/W41) mice via tail-vein injection as illustrated in e. After 16 weeks, erythroblasts (CD49d+, CD235a+) from bone marrows of the transplanted mice were analyzed for HbF+ fraction (%, f, n = 5 mice/biological replicates), RT-qPCR (g, n = 3 mice/biological replicates), and HPLC (h, n = 5 mice/biological replicates). Data are expressed as means ± SEM. * P < 0.05, ** P < 0.01. P values were calculated by comparing indicated samples to control with parametric unpaired two-tailed Student’s t-test. f. sgNFIA, P <0.0001; sgNFIX, P = 0.0424; sgNFIA&NFIX, P < 0.0001; sgBCL11A +58, P < 0.0001. g. sgNFIA, P < 0.0001; sgNFIX, P = 0.0051; sgNFIA&NFIX, P < 0.0001; sgBCL11A +58, P < 0.0001. h. sgNFIA, P < 0.0001; sgNFIX, P = 0.0107; sgNFIA&NFIX, P < 0.0001; sgBCL11A +58, P < 0.0001.
