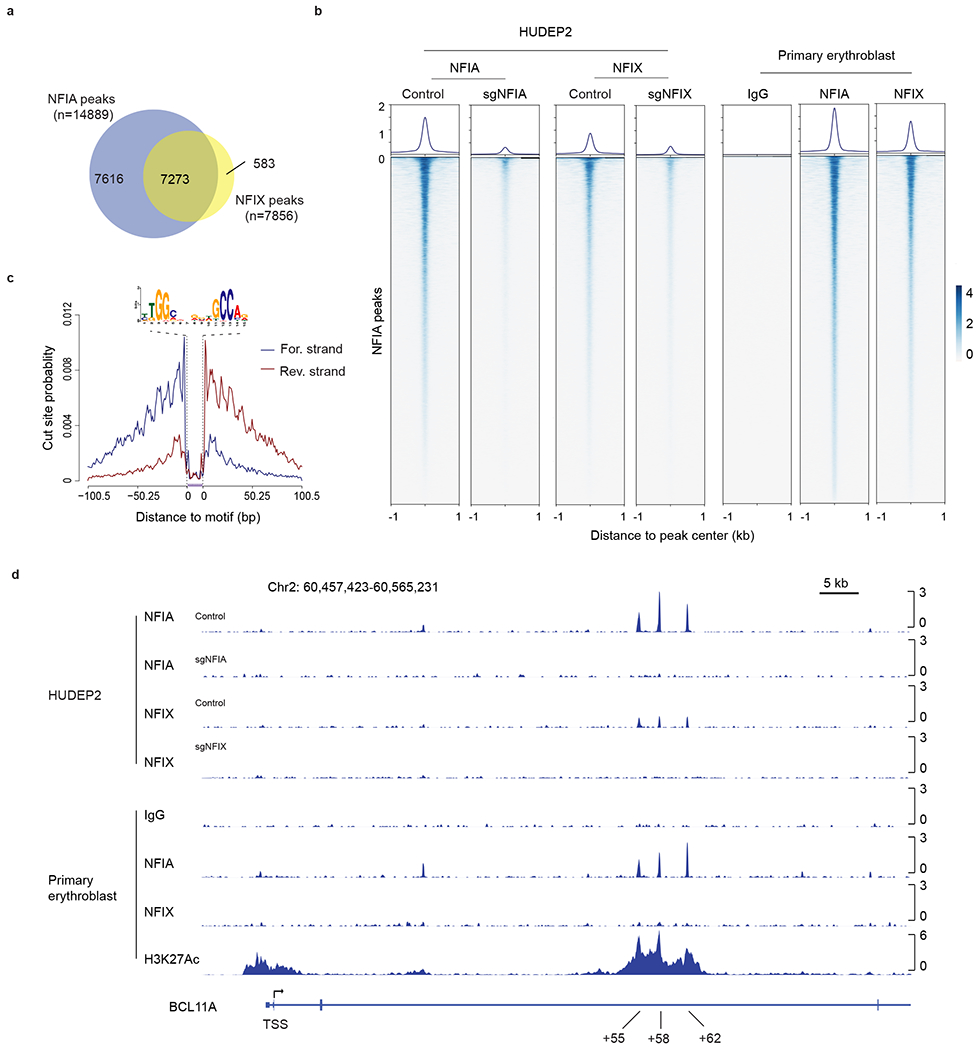
Fig. 4. NFIA and NFIX genomic occupancy profiles by CUT&RUN.

a, Venn diagram of NFIA and NFIX binding sites identified from CUT&RUN experiments. b, Visualization of NFIA and NFIX CUT&RUN peaks in HUDEP2 and primary erythroblasts by profile and heatmap plots. 14,889 NFIA peaks identified from HUDEP2 and primary cell CUT&RUN were used for generating this graph. Peaks are ranked by CUT&RUN tag counts. c, Representative footprint analysis result of de novo binding motif identified from the NFIA or NFIX CUT&RUN experiments. d, NFIA and NFIX occupancy profiles at the BCL11A locus in HUDEP2 and primary erythroblasts. NFIA KO (sgNFIA), NFIX KO (sgNFIX), and IgG served as controls.
