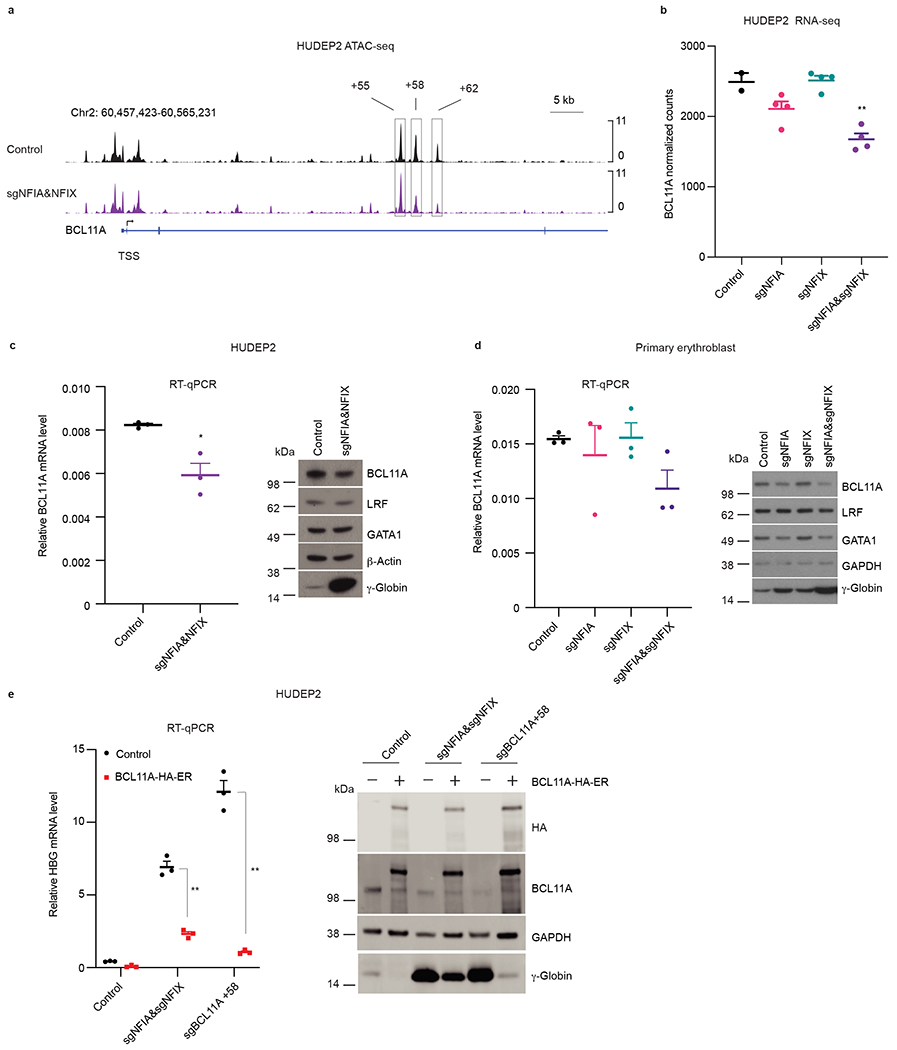
Fig. 5. NFI factors support BCL11A expression in adult erythroblast.

a, Enrichment of ATAC-seq signals at the BCL11A locus in control (n = 2) or NFIA and NFIX co-depleted (sgNFIA&NFIX, n = 2) HUDEP2 cells. The boxed regions are BCL11A +55, +58, and +62 enhancers. n represents biological replicates. b, Normalized counts of BCL11A mRNA in RNA-seq (n = 2 for control sgRNAs and n = 4 for NFIA depletion (sgNFIA), NFIX depletion (sgNFIX), and NFIA and NFIX co-depletion (sgNFIA&sgNFIX)). Data are expressed as mean ± SEM. ** P < 0.01. P values were calculated by comparing indicated samples to control with parametric unpaired two-tailed Student’s t-test. sgNFIA, P = 0.0952; sgNFIX, P = 0.8781; sgNFIA&NFIX, P = 0. 0049. c, BCL11A mRNA and protein levels in control and NFIA and NFIX co-depleted (sgNFIA&NFIX) HUDEP2 cells. RT-qPCR quantification of BCL11A mRNA in control and NFIA and NFIX co-depleted (sgNFIA&NFIX) HUDEP2 cells. Data were normalized to AHSP (n = 3 biological replicates). Data are expressed as mean ± SEM. * P < 0.05. P values were calculated by comparing indicated samples to control with parametric unpaired two-tailed Student’s t-test. P = 0.0141. Representative immunoblots of BCL11A, LRF, GATA1, and γ-globin in control and NFIA and NFIX co-depleted (sgNFIA&NFIX) HUDEP2 cells. β-Actin served as loading control. Experiments were performed more than three times with similar results. d, BCL11A mRNA and protein levels in indicated RNP modified primary cells. RT-qPCR quantification of BCL11A mRNA in control and indicated NFI factor depleted primary cells. Data were normalized to AHSP (n = 3 independent donors). Data are expressed as mean ± SEM. * P < 0.05, ** P < 0.01. p values were calculated by comparing indicated samples to control with parametric unpaired two-tailed Student’s t-test. sgNFIA, P = 0.6207; sgNFIX, P = 0.9306; sgNFIA&NFIX, P = 0. 0586. Representative immunoblots of BCL11A, LRF, GATA1, and γ-globin in control and NFIA/NFIX single or combined depleted primary cells. Similar results were obtained using samples from three additional donors. GAPDH served as loading control. e, HBG1/2 mRNA and γ-globin levels in control, NFIA and NFIX co-depleted (sgNFIA&sgNFIX) HUDEP2 cells, and sgBCL11A +58 HUDEP2 cells following overexpression of BCL11A cDNA as quantified by RT-qPCR and immunoblot. Data were normalized to AHSP (n = 3 biological replicates) and expressed as mean ± SEM. ** P < 0.01. P values were calculated by comparing samples from cells overexpressing BCL11A to those serving as controls with parametric unpaired two-tailed Student’s t-test. sgNFIA&sgNFIX, P < 0.0001; sgBCL11A +58, P < 0.0001. Endogenous and ectopic BCL11A were distinguished by anti-BCL11A and anti-HA antibodies. Immunoblots were performed twice with similar results.
