FIGURE 2.
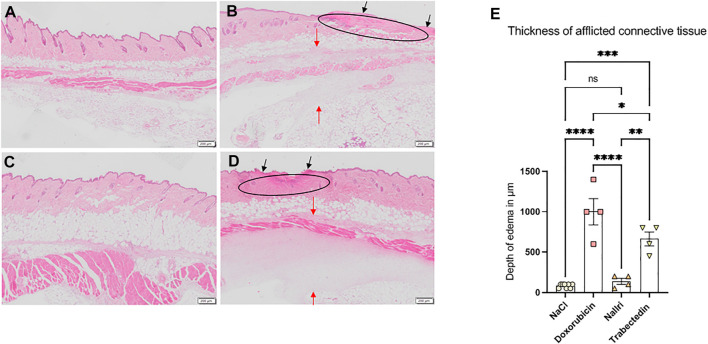
Images of H&E stained sections of affected skin area at day two of treatment with (A) 300 µl NaCl, (B) 150 µl doxorubicin, (C) 300 µl nal-Iri, (D) 150 µl trabectedin. Histological sections in B and D show the loss of epidermal continuity (black arrows), replacement of the dermis with granulation tissue (ellipse) more pronounced in B than in (D). Due to edematous changes, the loosening of the connective tissue occurs (red arrows in B and D). (E) Thickening of afflicted connective tissue layer statistically analyzed using ANOVA followed by a post-hoc test with a Tukey-B correction. *p < 0.05, **p < 0.01, ***p < 0.005, ****p < 0.0001, ns = not significant.

