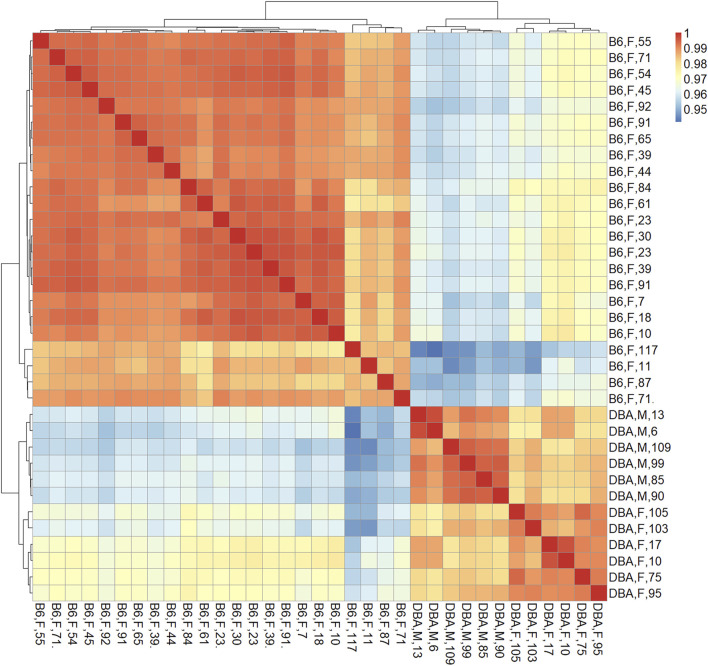
FIGURE 2.
Correlation matrix of DNA methylation profiles. Pearson correlation of DNAm at all CpGs (here also including X and Y chromosome) demonstrated that samples clustered consistently according to the mouse strain, independent of donor age. Sample names indicate mouse strain (B6: C57BL/6; DBA: DBA/2J), sex (M: male, F: female), and age in weeks.

