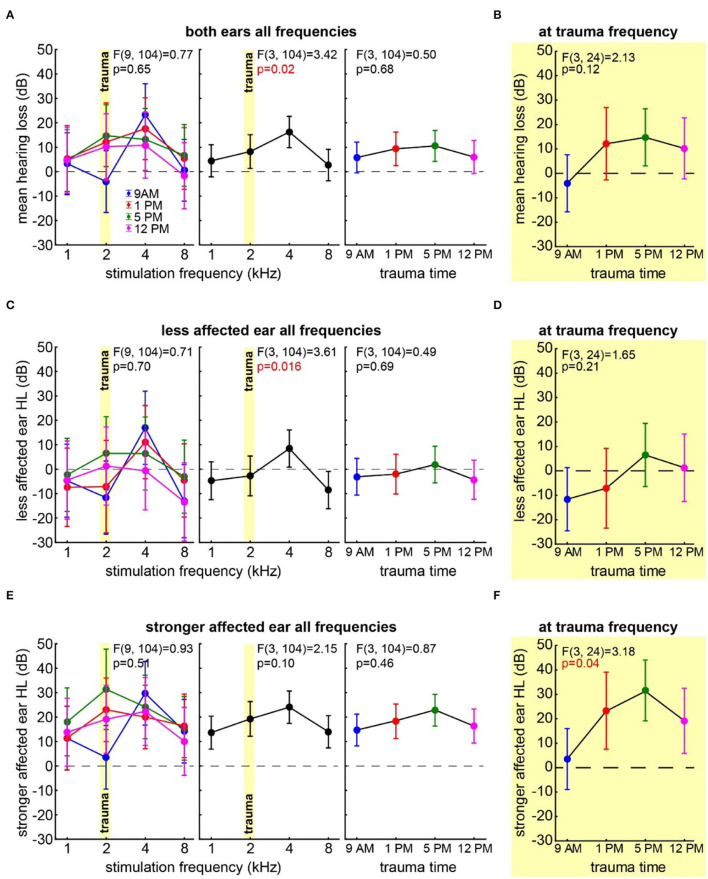
Figure 2.
Hearing loss one week after trauma at different times of the day. (A) Mean HL across both ears analyzed by a two-factorial ANOVA with factors time of day (right panel) and frequency (center panel), the interaction of both factors is depicted in the left panel, time of day is color-coded, the trauma frequency is marked by a yellow bar, and whiskers give the 95% confidence intervals, significant p-values of the F-statistics are red. (B) One-factorial ANOVA of the mean HL of both ears at the trauma frequency over the time of day. (C) Two-factorial ANOVA of the HL of the less affected ear with factors time of day and frequency. (D) One-factorial ANOVA of the HL of the less affected ear at the trauma frequency over the time of day. (E) Two-factorial ANOVA of the HL of the stronger affected ear with factors time of day and frequency. (F) One-factorial ANOVA of the HL of the stronger affected ear at the trauma frequency over the time of day.

