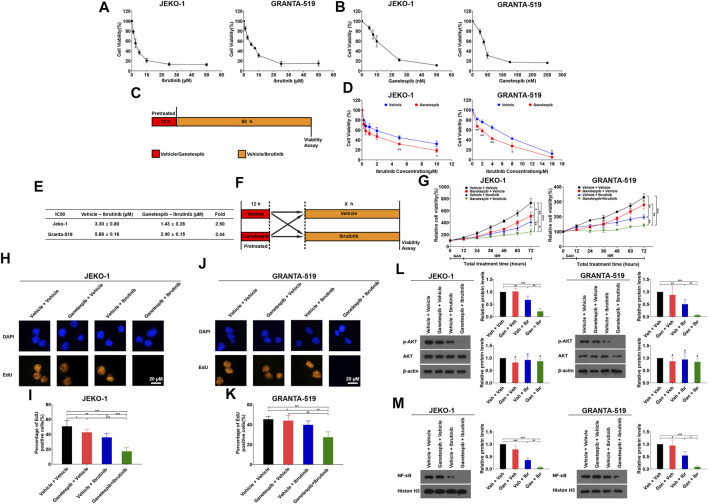
FIGURE 1.
HSP90 inhibitor ganetespib enhanced inhibition of BTK inhibitor ibrutinib on proliferation of MCL cells. (A) Jeko-1 and Granta-519 cells were treated with ibrutinib at the indicated concentration in 0.5% DMSO for 72 h and the cell viability was assessed by MTT assays, respectively. (B) Jeko-1 and Granta-519 cells were treated with ganetespib at the indicated concentration in 0.5% DMSO for 72 h and the cell viability was assessed by MTT assays, respectively. (C) The scheme of experimental settings. Cells were pretreated with either ganetespib at the indicated concentrations or vehicle for 12 h and ganetespib was then washed out. Then the cells were treated with either different concentrations of ibrutinib or vehicle for 60 h before cell viability was assessed by MTT assays. (D) Jeko-1 and Granta-519 cells were treated with ganetespib (15 nM for Jeko-1 and 45 nM for Granta-519 cells, respectively) in 0.5% DMSO for 12 h, and then treated with different concentrations of ibrutinib as indicated in 0.5% DMSO for 60 h before cell viability was detected by MTT. (E) IC50 values calculated by using data from (D). (F) The scheme of experimental settings. Cells were pretreated with either ganetespib (15 nM for Jeko-1 and 45 nM for Granta-519 cells, respectively) or vehicle for 12 h and then treated with either ibrutinib at 6 μM or vehicle for various periods of time as indicated before cell viability was assessed by MTT assays. (G). Jeko-1 and Granta-519 cells were treated with either ibrutinib at 6 μM or vehicle for various periods of time as indicated before cell viability was assessed by MTT assays. (H–M) Jeko-1 and Granta-519 cells were pretreated with either ganetespib (15 nM for Jeko-1 and 45 nM for Granta-519 cells, respectively) or vehicle and then treated with either ibrutinib at 6 μM or vehicle for 24 h. (H–K) Representative pictures and the statistics of EdU staining of JEKO-1 (H,I) and Granta-519 cells (J,K). (L) The protein levels and statistical analysis of p-AKT and AKT in Jeko-1 and Granta-519 cells treated as mentioned. (M) The protein levels and statistical analysis of NF-κB from nuclear extracts in Jeko-1 and Granta-519 cells treated as mentioned. Mean ± SD, n = 3.

