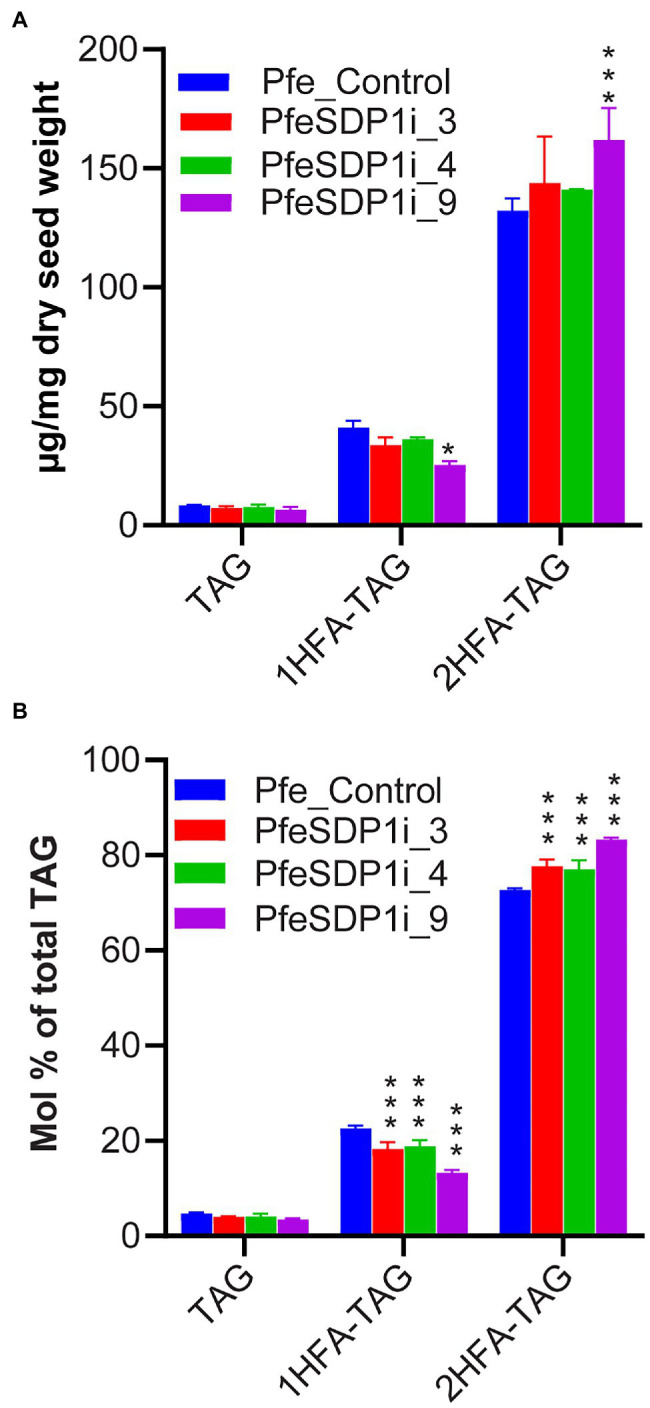
Figure 6.

Analysis of different TAG species in the seeds of SDP1 RNAi lines. The levels of different TAG molecular species were expressed as μg/mg dry seed weight (A) and relative percent (mol%) of total TAG (B). 1HFA-TAG and 2HFA-TAG represents TAG with one and two hydroxy fatty acids, respectively. Significant difference between wild-type control and PfeSDP1 knock-down lines was determined using two-way ANOVA (***p ≤ 0.001 and *p ≤ 0.33).
