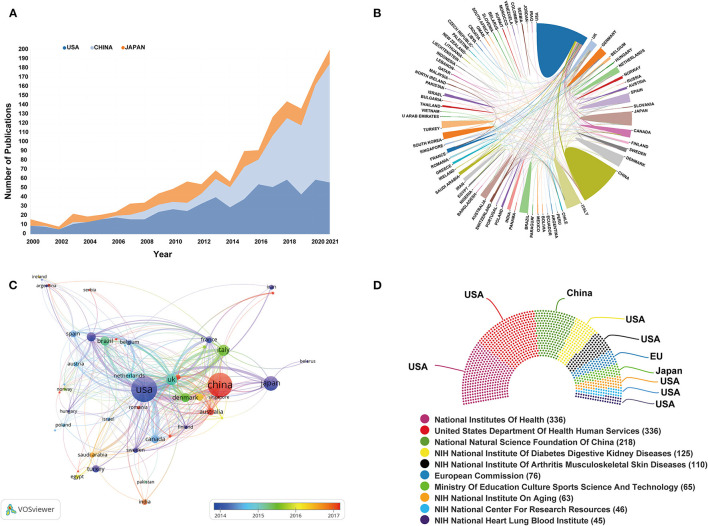
Figure 3.
(A) The annual publications of the top 3 countries from 2000 to 2021. (B) The international cooperation analysis among different countries. Line thickness between countries reflects the intensity of the closeness. (C) The overlay visualization map of country co-authorship analysis conducted by VOSviewer. Each country is represented as a node, and the node size is proportional to the sum of publications. A link between two nodes indicates a co-authorship relationship. Different nodes were given different colors (based on AAY) according to the color gradient in the lower right corner. (D) The top 10 most frequent funding sources in this field.

