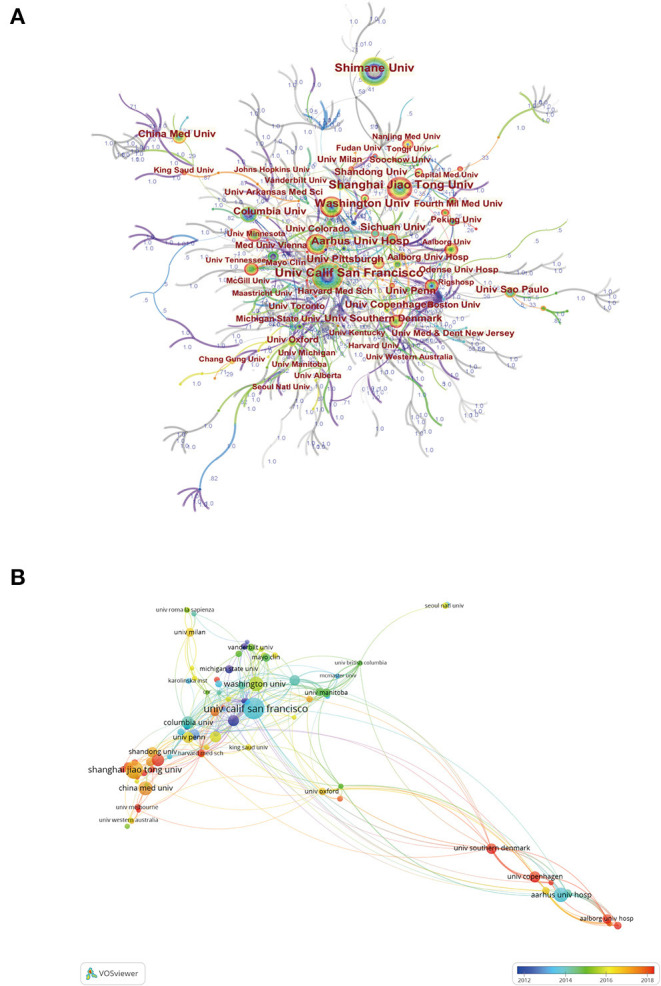
Figure 4.

(A) Network visualization map of institutional collaborations generated by CiteSpace. In this map, a node represents an institution, and the size of each node represents its relative quantity of research output. Each line represents the strength of the cooperation relationship between two institutions, and strength value is displayed between lines. (B) The overlay visualization map of Institution co-authorship analysis conducted by VOSviewer.
