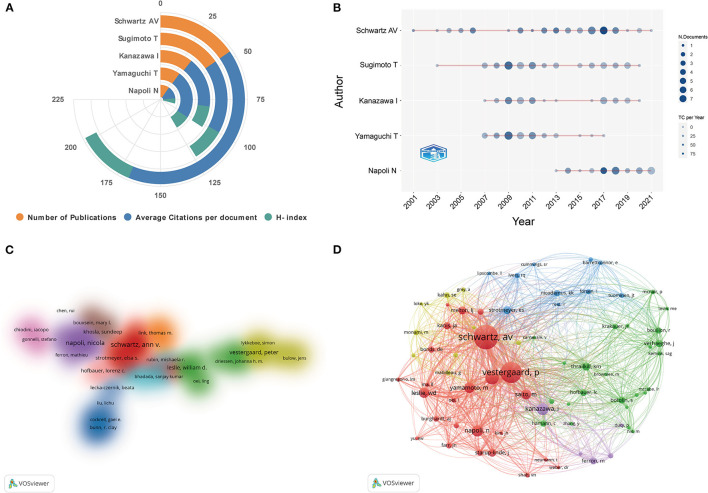
Figure 5.
(A) Total number of publications, average citations per document, and H-index of top 5 authors in this area. (B) Top 5 authors' production over time. The circle size represents the number of documents (N. Documents), and the shade of the color signifies the total number of citations (TC). (C) The cluster density map of author co-authorship analysis generated by VOSviewer. Authors with close cooperation relationship are assigned to one cluster with the same color. (D) The network visualization map of author co-citation analysis generated by VOSviewer. Each author is represented as a node, and the node size is proportional to the sum of citations. A link between two nodes indicates a co-citation relationship. The distance between nodes indicates the relatedness, and a smaller distance implies a higher relatedness and will be assigned to one cluster with the same colors.

