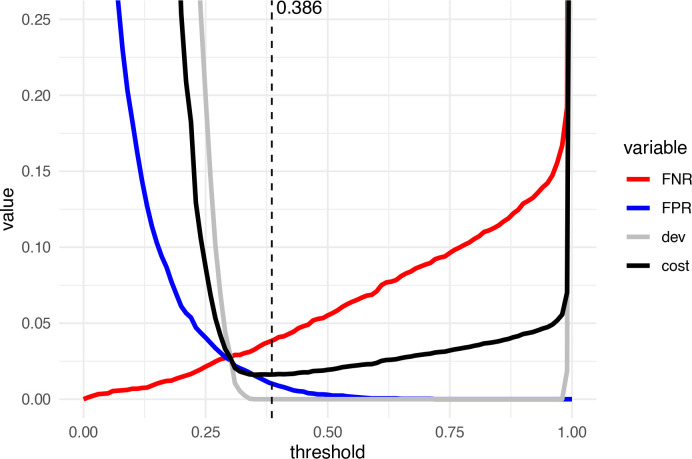
Figure 2. Illustration of the cost function to be minimized for thresholding.
Plotted are the false negative rate (FNR; the rate of misclassified artificial doublets), the false positive rate (FPR; the proportion of real cells classified as doublets), the squared proportion deviation from the expected doublet rate (denoted ‘dev’), and the integrated cost function to be minimized (mean of the previous). The dashed line indicates the threshold called.

