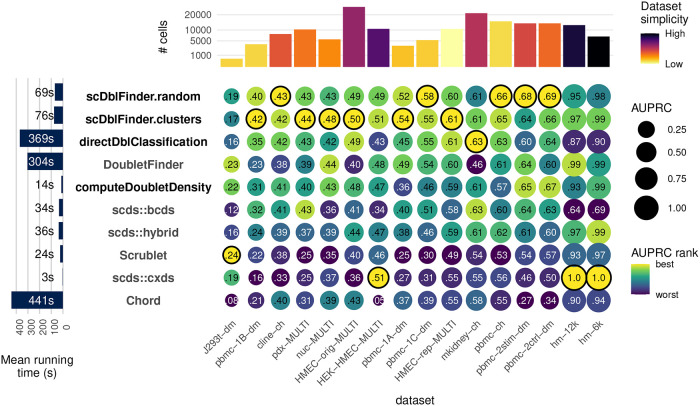
Figure 3. Benchmark.
Accuracy (area under the precision and recall curve) of doublet identification using alternative methods across 16 benchmark datasets. The colour of the dots indicates the relative ranking for the dataset, while the size and numbers indicate the actual area under the (PR) curve. For each dataset, the top method is circled in black. Methods with names in black are provided in the scDblFinder package. Running times are indicated on the left. On top the number of cells in each dataset is shown, and colored by the proportion of variance explained by the first two components (relative to that explained by the first 100), as a rough guide to dataset simplicity.

