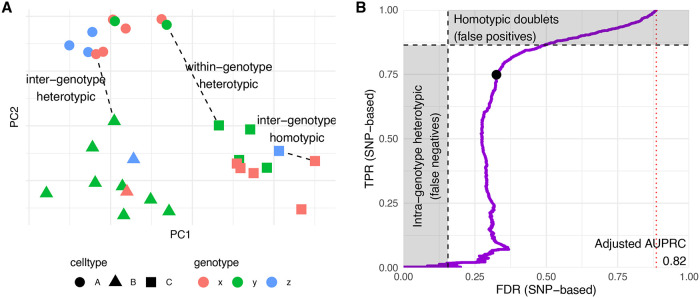
Figure 4. Doublet types and real accuracy of heterotypic doublet identification.
A: Cartoon representing the different types of doublets. Within-individual heterotypic doublets will wrongly be labeled as false positives, and between-individual homotypic will be labeled as false negatives. B: Adjusted PR curve for an example sample (GSM2560248). The two shaded areas represent the expected proportion of within-individual heterotypic doublets (i.e. wrongly labeled as singlets in the annotation used as ground truth) and between-individual homotypic doublets, respectively. The red dotted line indicates the random expectation, and the black dot indicates the threshold set by scDblFinder.

