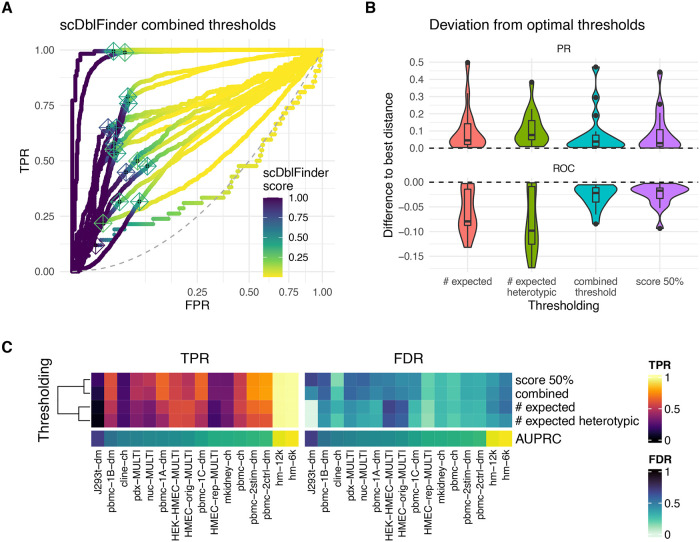
Figure 5. Thresholding.
A: ROC curves (with square-root transformation on the x axis) of the different benchmark datasets, colored by scDblFinder doublet scores, showing a rapid flip of the scores around the inflexion point. The crosses indicate the scDblFinder thresholds. B: Deviation from two ideals of thresholds based on different methods. In the PR curve, the ideal is defined as the minimal distance from the corner indicating a perfect precision and recall. In the ROC curve, the ideal is defined as the maximal distance from the diagonal. The y-axis indicates the difference between the distance at the threshold and the respective optimal distance. C: Tradeoff between True Positive Rate (TPR/sensitivity/recall) and False Discovery Rate (FDR/1-precision) using different thresholds.

