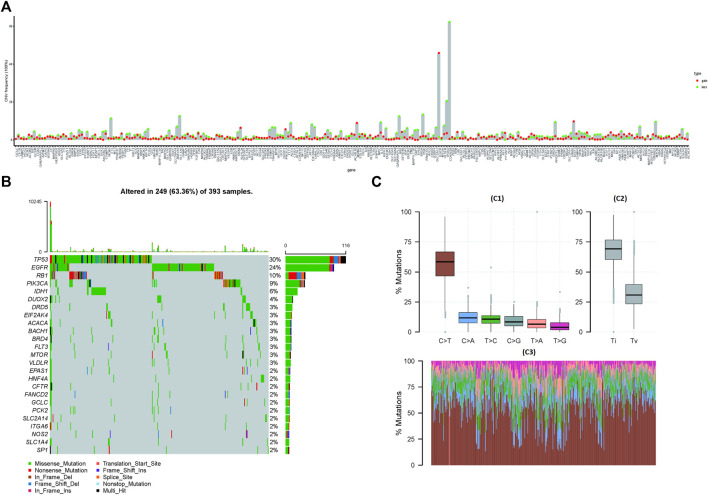
FIGURE 1.
Mutations and copy number variations (CNVs) in ferroptosis-related genes. (A) CNV of ferroptosis-related genes. The abscissa axis represents the name of the related genes; the ordinate axis represents the CNV frequency. The type of CNV represented by red is gain; the type of CNV represented by green is loss. (B) Waterfall chart of ferroptosis-related gene mutations. The ordinate axis on the left represents the names of the top 25 genes, and the ordinate axis on the right represents the mutation frequency of the corresponding genes; different colors represent different types of gene alterations. (C) SNP of TCGA-GBM samples (C1): the abscissa axis represents the type of SNP; the ordinate axis represents the mutation percentage. (C2): the abscissa axis represents the type of variants (transitions or transversions); the ordinate axis represents the percentage of mutations. (C3): the abscissa axis represents the TCGA-GBM samples, in which different colors represent different SVP types, and the ordinate axis represents the percentage of variation in each sample.

