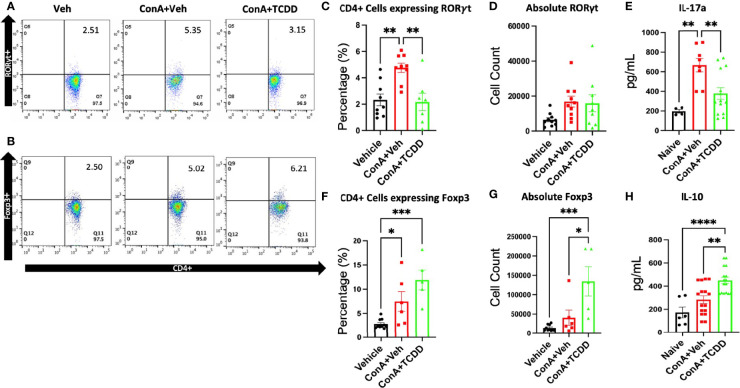
Figure 2.
TCDD treatment alters the ratio of Th17/Treg cells in the liver. C57/BL6 mice were injected with ConA followed by vehicle or TCDD 1 hour later as described in Figure 1 legend. After 24 hours, liver mononuclear cells were harvested and stained for Th17 (CD4+RORγt+) and Treg cells (CD4+Foxp3+). (A, B) Representative flow plots showing cells double-stained for the markers. (C) Percentage of Th17 cells. (D) The absolute number of Th17 cells found per animal. (E) Measurement of IL-17A by ELISA in cell cultures. (F) Percentage of cells expressing CD4+FoxP3+. (G) Total number of cells expressing Foxp3/per mouse. (H) Measurement of IL-10 in cultures. (n = 5-10 mice) Significance was determined by one-way ANOVA followed by Tukey’s post-hoc test. Vertical bars represent Mean +/- SEM. *p < 0.05, **p < 0.01, ***p < 0.001, ****p < 0.0001.

